BIG BLUE FANS FOR
![]()
BASKETBALL
2010-11 Season Analytical Writings
12A
IS THE 2010-11 KENTUCKY BASKETBALL TEAM INCONSISTENT?
In the first 5 to 10 games of a season, the average performance measures for a team are volatile because a single extreme performance, good or bad, has a substantial impact upon the average performance levels for all games played to date. However, as the number of games increases in the early portion of a season, the volatility diminishes to the point that a single game's extreme performance only affects the overall average performance measurements to less significant degrees.
Nevertheless, my methods are consistent in predicting the next game's margin based solely upon the state of the data prior to that game, recognizing that this same volatility will yield poor game-to-game comparisons, predicted v actual margins. However, as the volatility diminishes, the reliability of the predictions improves for the remainder of the season. Perhaps I should not even publish predictions for games until after the volatile stage has passed, but I do so solely to maintain the transparency of my work. I realize that this gives critics their annual opportunity to make their standard retorts that the numbers are meaningless.
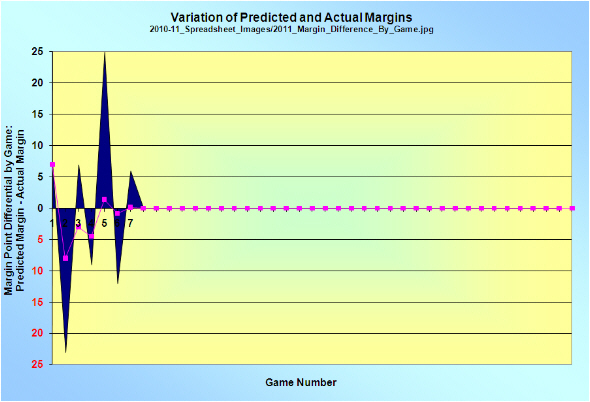
The 2010-11 season is now 7 games old and the above graph shows the game to game point differential between the predicted and actual margins. A positive difference means the team underperformed the prediction model, and a negative difference means the team over performed the prediction model. There are some interesting features emerging this year from this summary of results.
• The average difference after seven games is essentially zero points, which means taken together, the average predicted margin has been equal to the average actual margin.
• The team has been a Jekyll and Hyde, performance wise, and the team has underperformed and out performed in alternating games.
• There have been 2 games in the first 7 in which the team's actual performance significantly varied from the model prediction [Game 2 Over Performed by 23 points; Game 5 Under Performed by 25 points]
Therefore, this begs the question. Are these early season variations a result of the unreliability of the prediction model or the inconsistency of this UK basketball team? As I noted above, a substantial part of these early season game-to-game variations are due to the volatility of the prediction model. That is inescapable, and that is the case each season, as described above. However, this is not a sufficient explanation for the magnitude of this season's early variations.
The game-to-game variations can be measured, and has been measured for all but 2 seasons [2003 and 2004] since 2000 and for 1996 by measuring the Variance [Std Dev/Avg] of the game to game offensive and defensive efficiencies. These average offensive and defensive efficiencies and the respective variances are measures of the actual play of the team and have absolutely nothing to do with the prediction modeling. The following table provides that data for 1996, 2000-2002, and 2005-2011 for the Variances, and 1996, and 2000-2011 for the Efficiencies.
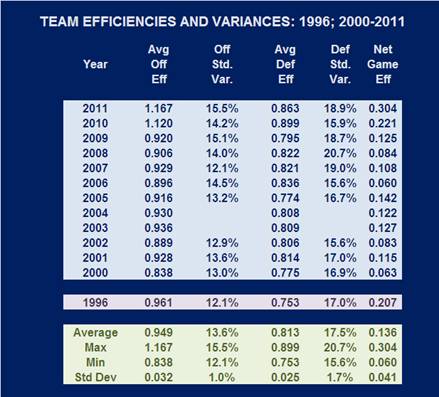
TABLE I
AVERAGE EFFICIENCIES AND VARIATIONS
A reader should know that the reported efficiencies in this table are based upon two different definitions of a possession that affect the values. The values for 2010 and 2011 are based on the same definition, while all years prior to 2010 are based on a previous definition of a possession. While this change affects the magnitude of the efficiencies, it does not affect the year-to-year comparison of Variances.
Unless this team's consistency improves moving forward, its 15.5% variance will be the most inconsistent offensive team since I began tracking these variances. The previous most inconsistent offense was the 2008 team with a Variance for the entire season of 15.3%. Unless this team's consistency improves going forward, its 18.9% variance will be the third most inconsistent defensive team, with 2008 remaining the most inconsistent defense at 20.7%, and 2007 remaining second most inconsistent defense at 19.0%.
It is important to note that greater inconsistency does not equal poorer average efficiency, as a comparison of 2010 and 2011 illustrates. The offensive efficiency, defensive efficiency, and Net Game Efficiency is better to date for 2011 than 2010, but the Variances are higher for 2011 than 2010. A similar relationship exists for 2008 and 2009 for offensive efficiency, yet the defensive efficiency and variance are both better for 2009 than 2008. Variance and average efficiencies are not dependent upon each other. A team can play very consistently at a poor efficiency, as well as play very inconsistently at a better efficiency.
This UK team is playing inconsistently in the early part of this season. However, UK teams over the last few years have become more inconsistent. This trend began near the end of the Tubby Smith Era [2005 to 2006 period] and has continued through the Gillispie Era and the first 2 years of the Calipari Era. To return to championship form, UK teams must improve in both areas of these measures, become more efficient and more consistent. The 1996 team remains the benchmark for both performance measures.
It is not possible to know whether this team's consistency will improve moving forward, but it should be clear that improved consistency must be a goal for this team.
Submitted by Richard Cheeks
Submitted by Richard Cheeks
![]()
To
Cats Take 5-2 Record To Freedom Hall and Notre Dame
Go Back
Cats Fall At North Carolina by 2
Copyright 2010
SugarHill Communications of Kentucky
All Rights Reserved