BIG BLUE FANS FOR
![]()
BASKETBALL
2011-12 Season Analytical Writings
19A
Why Am I So Excited About This Team?
One of the most efficient players to wear a UK uniform over the last 15 years, since and including the 1996 Gold Standard team is Chuck Hayes. Using the individual efficiency calculations that I am now applying to the current team, Chuck Hayes' individual efficiencies by season were:
2002 32 games 534 Minutes 0.549 points per possession
2003 36 games 996 Minutes 0.428 points per possession
2004 32 games 991 Minutes 0.494 points per possession
2005 34 games 995 Minutes 0.424 points per possession
Through ½ of his freshman season, Anthony Davis has played in 16 games, 464 minutes, and has posted an individual efficiency of 0.697 points per possession. He is in the process of rewriting the UK record books on a team that is in the process of challenging the 1996 UK team as the new Gold Standard of UK basketball. This team will have the numbers, and all that it will need to accomplish what few thought possible is hang the eighth championship banner in the rafters of Rupp Arena.
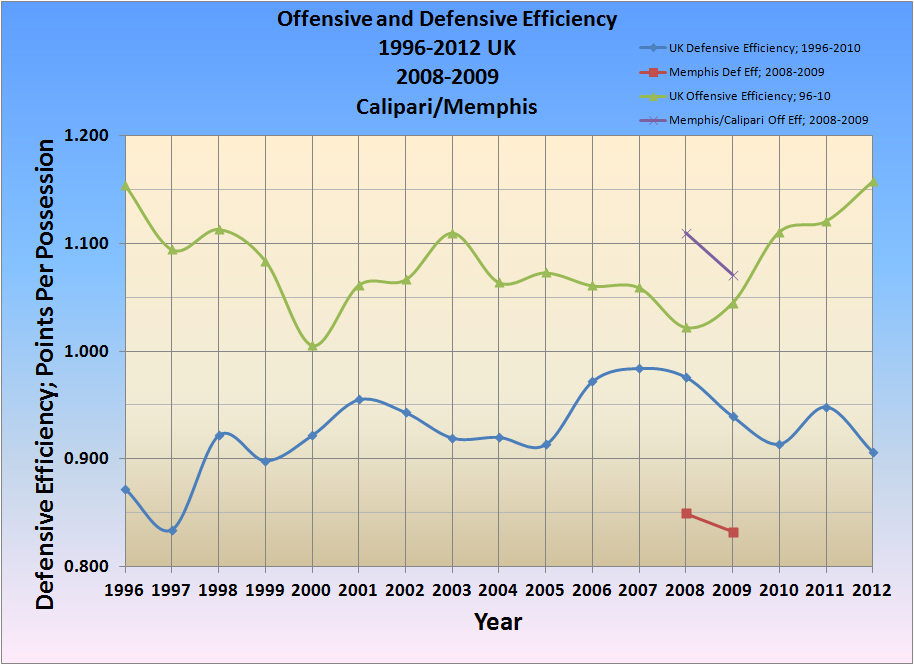
Offensive and Defensive Efficiencies
1996 to 2012
1996 and 1997 were Coach Pitino's last 2 years. The 1996 team won UK's 6 th championship and was an overtime loss in the championship game in 1997 away from a repeat. The 1998 team did win UK's 7 th championship, but the average season long numbers are not indicative of the level of play required to win that championship because of the generally weak play for the first 20 games of that season. From 1998 through 2009, no UK team played at a level consistent with NCAA championship teams, or on the standards of quality that the 1996 and 1997 teams defined.
Then along came Coach Calipari. Notice the short line segments, blue and red, for his last two Memphis teams in 2008 and 2009, and particularly notice how those levels of offense and defense track closely to the offensive and defensive efficiencies of UK's 1996 and 1997 teams. Then notice how quickly Coach Calipari began to affect the quality of play of his UK teams, starting in his first season [2010], continuing into 2011, and not moving to the championship levels of play, particularly on defense, in 2012.
This same result is illustrated on the following two graphs, each spanning the same seasons, 1996 through 2012. The 2012 team is doing what championship teams do, outscoring opponents by over 17 points per game, which correlates to a NGE of 0.270 ppp or higher.
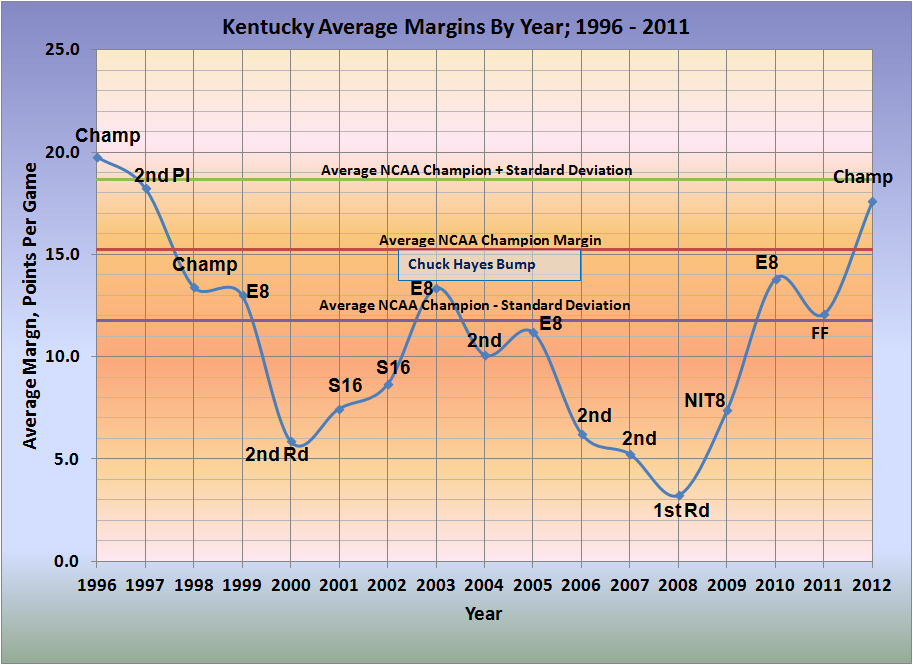
Average Margin, Points Per Game
1996 To 2012
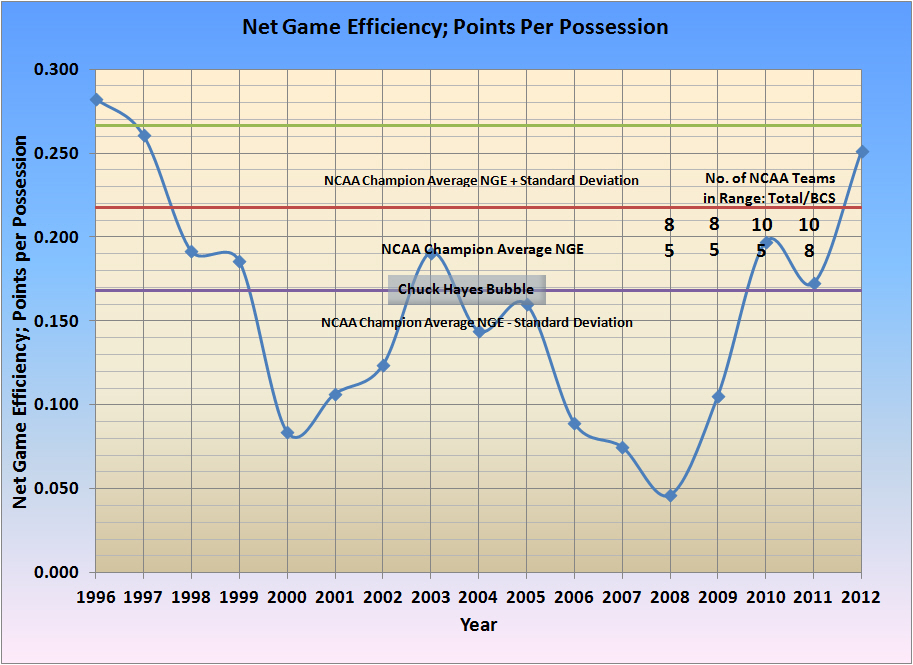
Net Game Efficiency, Points Per Possession
1996 To 2012
Yet people still ask why I am so high about this team.
Submitted by Richard Cheeks
Submitted by Richard Cheeks
Go Back
To Cats Open SEC Season With 15 Point Win Over South Carolina
Copyright 2012
SugarHill Communications of Kentucky
All Rights Reserved