BIG BLUE FANS FOR

BASKETBALL
2016-17 Season Analytical Writings
14A
Efficiency Based Game Predictions Are Reliable and Right On Schedule
The 2016-17 college basketball season has seen 34 days of basketball consisting of 1,568 games. Prior to each game, efficiency-based systems provide a predicted outcome that includes the winning team, the theoretical margin, and the probability that the favored team will win the game. How do these predictions compare to the actual outcomes at this stage of the season? For the record, an Upset occurs whenever the team with the higher probability of winning loses the game.
It is essential to understand that if the favored team has a probability of winning, there is a corresponding probability, equal to 100% minus the winning probability, of that same team losing the game. Therefore, one should expect about 40% of the outcomes to vary from the prediction for all games having a 60% probability that the favored team will win the game. Similarly, one should expect about 10% of the outcomes to vary from the prediction for all games having a 90% probability that the favored team will win the game. For this reason, one cannot simply look at the total number of games that end with a contrary result. Rather, one must separate all games into narrower probability ranges and examine the results for each of these narrower ranges. The narrower the range, the more precise the analysis.
TABLE 1: UPSET RATE DATA FOR CURRENT SEASON AND
2012-13 THROUGH 2015-16 THROUGH DAY 34
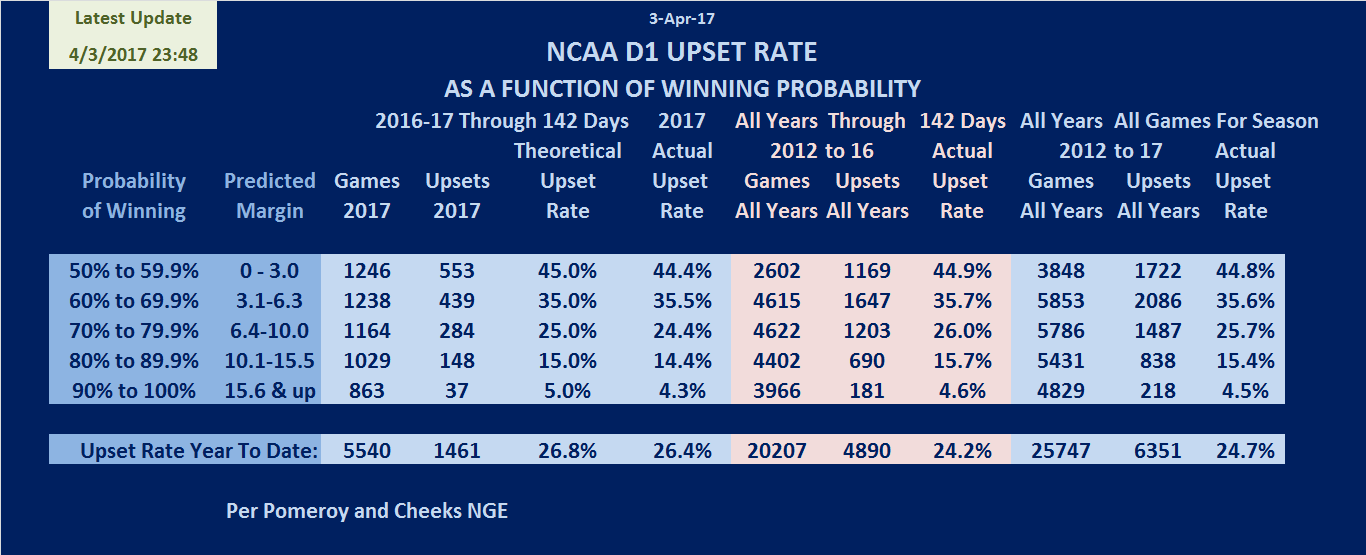
For the purposes of this analysis, I have used five narrower probability segments, in the 50-59.9% range, 60.0-69.9% range, . , to the 90.0-99.9% range. There are no games with either a 0.0% or 100.0% probability of an outcome regardless of the magnitude of the theoretical margin. Table 1 shows the data for the current season together with the cumulative data for all seasons since 2012 through the 34 th day of each of those seasons.
The theoretical Upset rates for the five probability ranges are shown in Table 1 in the 5 th column. The actual Upset rates for the current season appear in the 6 th column. The three pink columns to the right of the 2016-17 actual upset rates are the cumulative data, through the 34 th day of each season, for 2012-13 season through 2015-16 season, and the final three columns to the right of the pink columns are the cumulative results including the current 2016-17 season.
Table 1 indicates variations through 34 days of between 0.2% (50's range) to 2.5% (90's range) for the current season, with the variation tending to increase as the probability range rises from the 50's to the 90's. However, the cumulative data through 34 days shows a somewhat different trend with regards to the variation. The variations are 0 to 0.4% for all ranges except the 90's range which has a variation of 2.4%. Why have games having win probabilities in the 90's range experienced upsets at about ½ of the theoretical upset rate for the range?
TABLE 2: SUMMARY OF SEASON ENDING DATA
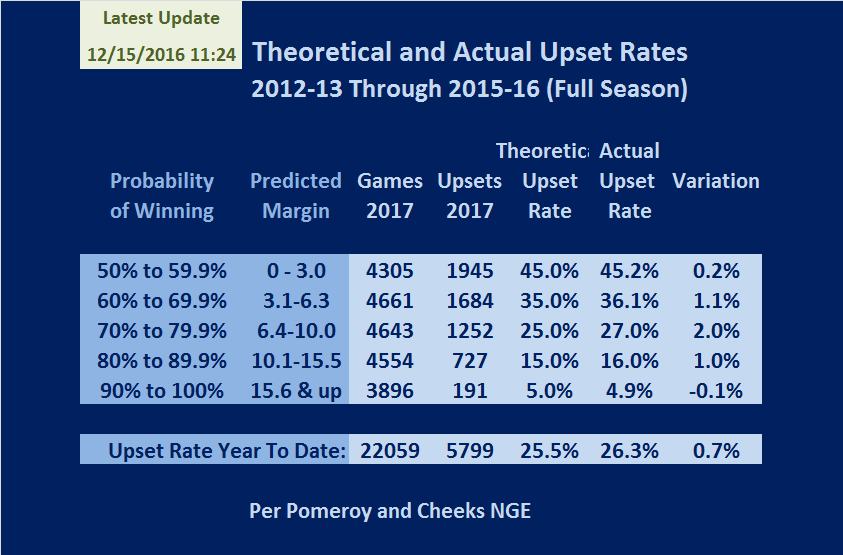
Before addressing this question, it is helpful to also look at the season ending relationships between the theoretical and actual upset rates for these ranges. Table 2 below provide the season ending actual upset rates, by upset range.
Over the years, the probabilities have been most accurate for the entire season, in the aggregate, for the ranges at the extremes (50's and 90's) and less accurate for the 70's range. In addition, the overall upset rate climbs over the last three months of these seasons. The actual and theoretical upset rate has reached a temporary peak early in the season, approximately after about 18 days of competition at about 23.1%. Then the upset rate declines over the next 32 days to a low of about 21.4% on day 50. Then, the upset rates begins to climb steadily to its season peak which tends to occur at about day 105 with a value of 26.5%. The upset rate remains relatively stable to the end of the season at an average of 26.1% for the four seasons of full data.
These season segments are interesting. Segment 1 (Day 1 to Day 18) is most of November, through Thanksgiving, a period marked by many early season competitive showcases such as the Champion's Classic, the Maui Classic, and many others. This segment includes a higher percentage of very competitive games. Segment 2 (Day 19 to Day 50) is the last week of November and most of December, through Christmas, a period marked by the top flight teams enjoying the taste of multiple cupcakes of assorted colors and names. This segment includes a higher percentage of very non-competitive games. Segment 3 (Day 51 to Day 105) is the end of December to the end of February. This period corresponds to the conference seasons, a period marked by very intense competition, especially over the first 2/3 of this period when nearly all conference teams hold hopes of a high enough finish in their conference ranks to earn a post season tournament invitation. However, by the last 2 weeks of the conference races (end of February extending into early March, these issues have largely been resolved, and the upset rate again halts its climb, and remains stable to falls slightly through the post season play to the championship game.
FIGURE 1: AVERAGE UPSET RATE FOR ALL SEASONS BETWEEN
2012-13 THROUGH 2015-16

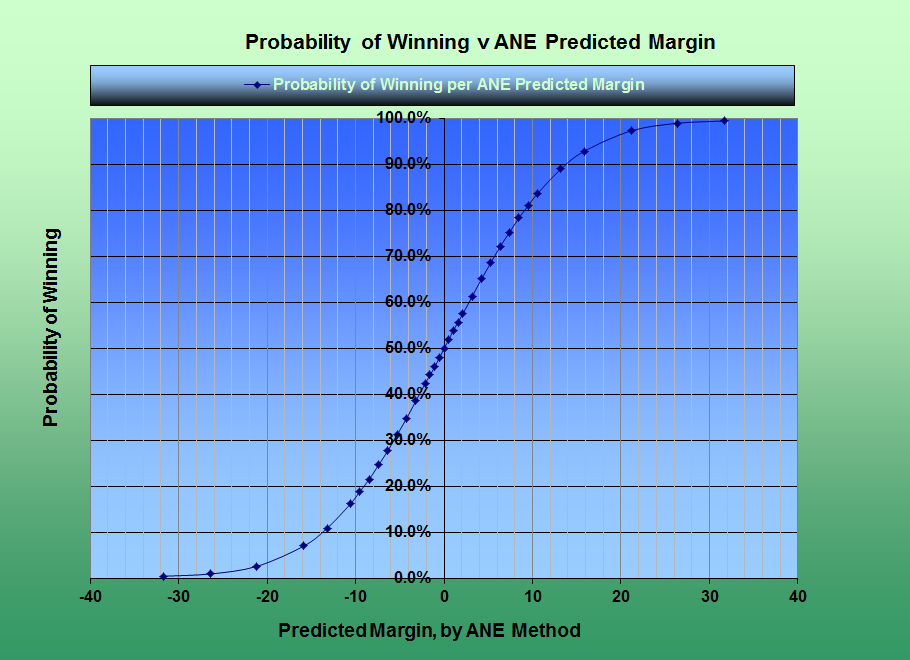
Upsets occur in all sports. They occur primarily due to natural variations in human performance levels over time. The efficiency based model used to establish theoretical game margins produces win probabilities that are reliable. Figure 2 provides the current win probability relationship based on a theoretical game margin determined by the ANE method. When the theoretical margin is 1 point, the probability of the favored team winning the game is about 54%. When the theoretical margin moves to 2 points, the probability increases to about 58%. When the margin rises to 5, 10, 15 or 20 points, the probabilities rise to about 69%, 82%, 92%, and 97% respectively. As noted earlier, games with theoretical margins in excess of 20 points have win probabilities of 97% to 99.999%, but never reach a statistical certainty.
FIGURE 2: WIN PROBABILITY AS A FUNCTION OF THEORETICAL GAME MARGIN
The last element of this analysis is when is it reasonable for the fan to either worry about a realistic upset likelihood or hope for an upset occurring for his/her team? In my opinion, the answer lies in the pattern of variations between the predicted game margin and the actual game margin, primarily measured by the standard deviation of the variations that occur. Historically, the ANE model results in a standard deviation for this variation of about 11 ¾ points. When the predicted margin is less than ½ the Standard Deviation (0 to 5 points), the likelihood of an upset is reasonably high. When the predicted margin is between ½ and 1 standard deviation (5+ to 11 ½ points), upsets are clearly possible. When the predicted margin falls between 1 and 2 standard deviation units (11 ½ to 23 points), upsets while possible are quite rare. Similarly, when the predicted margin exceeds 23 points, upsets are extremely rare.
Submitted by Richard Cheeks
![]()
To Cats-Tar Heels Face Off In Las Vegas
Go Back
To Cats Coast To Win Over Hofstra
Copyright 2016
Sugar Hill Communications
All Rights Reserved