BIG BLUE FANS FOR
![]()
BASKETBALL
2015-16 Season Analytical Writings
16A
How Are Cats Doing As Compared To Average NCAA D1 Efficiency?
Some fans have been expressing concern that this team is NOT playing defense very well, which is an interesting question. Please recall that perceptions based on individual games can be deceptive, and second, the Pomeroy numbers, as with mine, are based on the complete body of work, which is influenced by the peaks and valleys of individual games, but not dominated by them.
The raw efficiency values are simple to compute, total points scored divided by total possessions used where a used possession occurs with a shot attempt, a trip to the free throw line, or a turnover, but the total number of possessions must then be reduced by the number of offensive rebounds. The adjusted efficiency values are the raw values adjusted for strength of opponent and venue, which he incorporates into his published schedule strength value. Pomeroy does not share his methodology for the adjustments he makes, and suffice it to say my adjustments while similar to his, are not identical.
First, the average efficiency of all teams this season through 2 months is slightly higher than the average efficiency of the last 15 years, and slightly higher than the efficiency during the Calipari Era. However, the amount that this season is higher than these means is very small, and 2016 ended with an even higher average efficiency than has occurred so far this season, and 2014 had the highest average efficiency since 2002. There does appear to be some significant changes that have occurred during the 15 year span. From 2002 through 2007, the average efficiency climbed from about 1.012 ppp to about 1.025 ppp. Then starting in 2007 through 2013, the average efficiency declined steadily to about 1.010 ppp. In 2014, the average efficiency jump substantially to about 1.050 ppp and in 2015, 2016, and 2017 to date, the value has jumped down, up and down again, but the lowest average in this span was about the same as the high water mark (2007) for the 12 prior seasons.
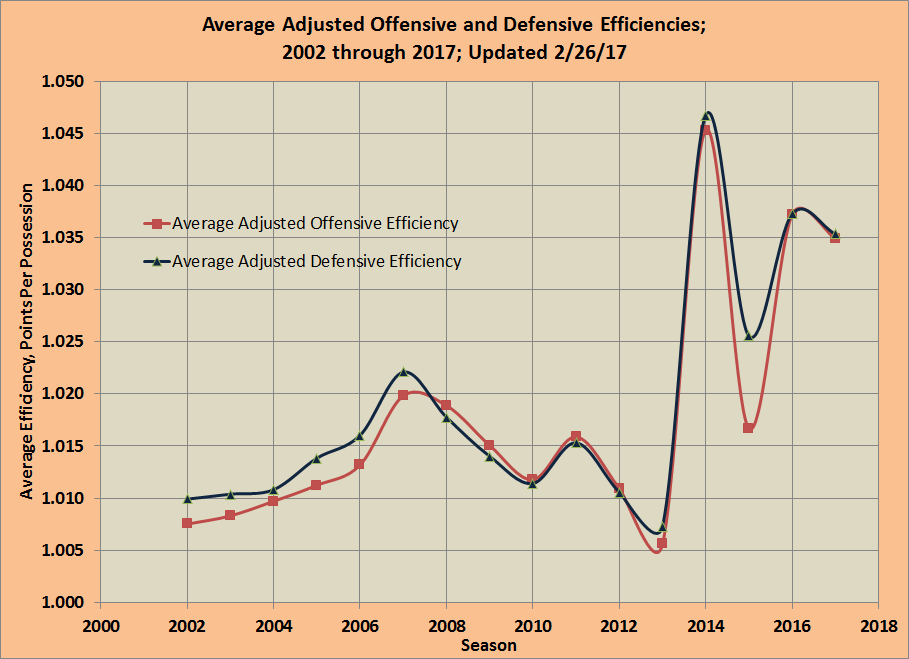
As I recall, the NCAA attempted to change the officiating emphasis in 2014 with mixed success according to some. However, I believe the shift in the range of the average efficiency over the last 4 seasons is consistent with structural changes that favor the offense, at the expense of the defense.
Second, UK's performance relative to these NCAA averages is interesting. The Calipari offenses on average have been 0.155 ppp higher than the NCAA D1 average for a particular season. However, the season to season offenses have been as strong as +0.202 ppp in 2012 and as weak as +0.099 ppp in 2013. This season's offense to date has been +0.194 ppp, which is high enough to be Calipari's 2nd most efficiency offense, just slightly below the 2012 high water mark for offensive efficiency.
The Calipari defenses on average have been -0.128 ppp lower than the NCAA D1 average for a particular season. However, the season to season offenses prior to this year have been as strong as -0.173 ppp in 2015 and as weak as -0.070 ppp in 2013. This season's offense to date has been -0.177 ppp, which is low enough to be Calipari's most efficient defense.
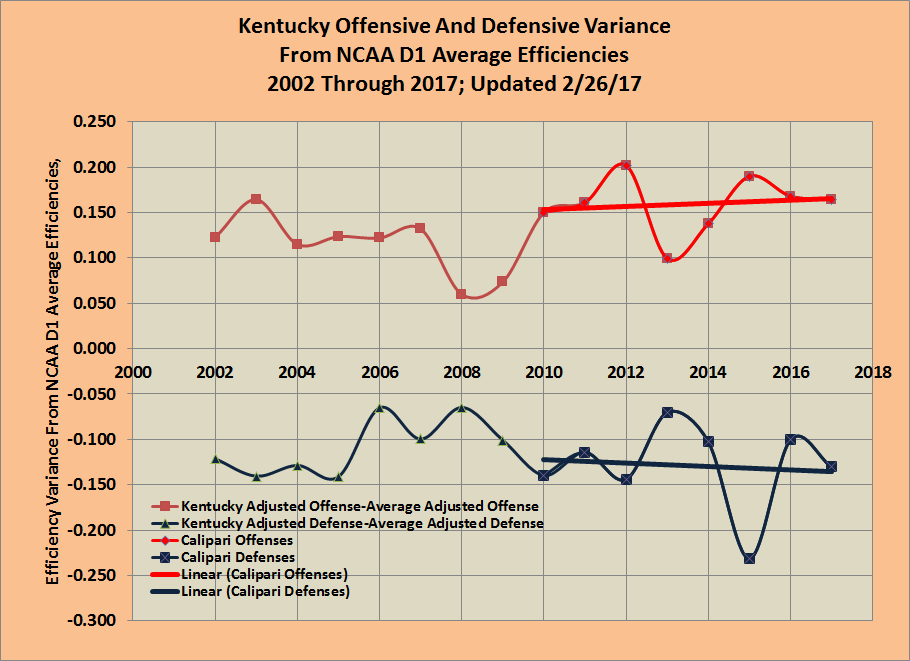
As most of you probably understand, I believe the best measure of team strength is not simply the offense or the defense, but the Net between them. Prior to this season, the 2012 team was Calipari's strongest team by that measure, followed by the 2015 defensive juggernaut. However, through 13 games,this team is currently performing at a higher level. Whether they can sustain this over the full season remains to be seen.
One last point about this team, the pace of play has increased from all prior years by about 12 possessions per game. Even though the UK defensive efficiency has been strong this season, opponents are scoring more points simply because they are getting 12 more possessions in games than in prior years. That additional 9 to 10 points per game may contribute to the impression that this team's defense has not been as strong. However, this situation simply reinforces the need to normalize scoring and scoring defense against the pace.
In the extreme, Virginia is only allowing about 50 ppg this season, and so many of the talking heads rave about how great their defense is. However, the Virginia team only averages about 60 possessions per game which is the slowest pace in NCAA D1 basketball this season while the Cats average nearly 80 possessions per game which is the 10th faster in college basketball this season. Those additional 20 possessions allow UK's opponents to score more points than UVA's Opponents can score in their 60 possessions, but that does not mean UVA's defense is that much superior to the UK defense. In reality, both defenses are top flight college defenses. I am glad to see the Cats playing at 80 possessions per game, and I hope Calipari does not pull back on the bit and slow this group down.
Submitted by Richard Cheeks
Submitted by Richard Cheeks
![]()
To Cats Return To Rupp To Host Texas A&M
Go Back
To Cats Open SEC With 23 Point Road Win Over Mississippi
Copyright 2016
SugarHill Communications of Kentucky
All Rights Reserved