BIG BLUE FANS FOR
BASKETBALL
36A
The 2017-18 Basketball Season
Kentucky Has Been The Most Consistent SEC Team
The 2017-18 regular season has ended, and there are some conclusions we can draw about this season, particularly this UK basketball team.
• This team finished with the 4 th best adjusted net efficiency in the conference behind Tennessee, Auburn and Florida.
• This team earned the #4 seed for the post season SEC Tournament
• The SEC from top to bottom had no team outside the ANE top 100 at the end of the regular season, one of the most balanced seasons in SEC memory.
• Kentucky was the most consistent teams in the SEC.
What! How can I make such an absurd assertion when everyone knows this team's biggest bugaboo was its unacceptable absence of consistency?
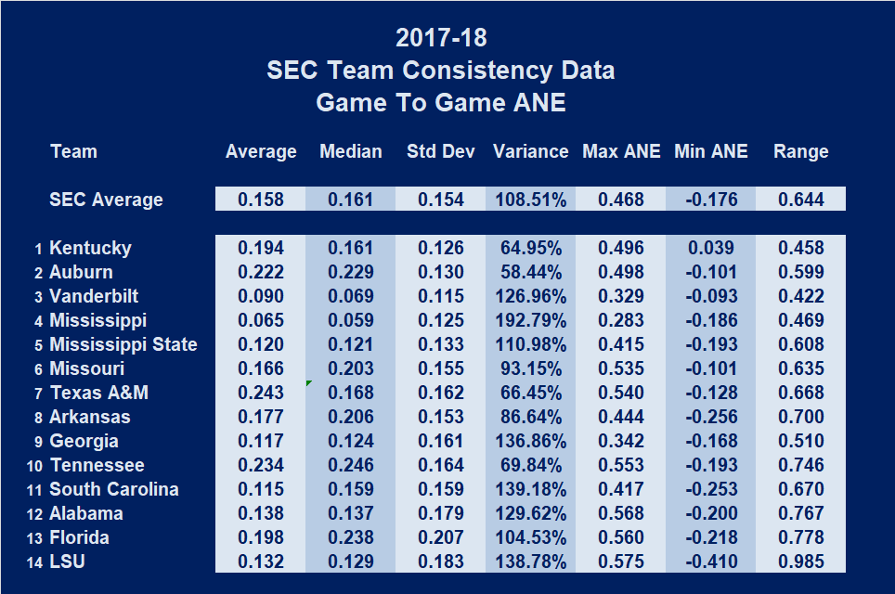
However, let's be clear about what consistency is. It is measured by the degree of variation that occurs between the highest and lowest levels of performance over the course of the full season. The table above shows relevant data for the SEC teams.
First for some fundamentals. No team plays at the same level or quality game in and game out. Rather, because this is a human endeavor, (“the kids are not machines” John Calipari), performance levels vary. Some games, and actually it is about ½ of all games, a player, a team, an anything will perform at a level above its average level and in some games, and actually it is about ½ of all game, a player, a team, an anything will perform at a level below its average level. Therefore, every fan should know that his/her team will experience these normal human variations.
There are several ways we could measure the inconsistency of play.
• The magnitude of the difference between a team's very best effort and its poorest effort, shown in the Table as “Range.”
• The Standard Deviation for the data set.
• The variance for the data set, where variance is the Standard Deviation divided by the mean for that same data set.
MAGNITUDE:
Kentucky's best performance this season was against Louisville with a game ANE of 0.496 ppp and its worst performance was 0.039 ppp against UCLA. The magnitude of this swing from its best to poorest performance is 0.458 ppp. This is the second smallest magnitude in the SEC this season, second only to Vanderbilt's 0.422 ppp. The SEC average magnitude is 0.644 ppp. The three teams that finished ahead of Kentucky in the SEC had Magnitudes of 0.599 ppp (Auburn), 0.746 ppp (Tennessee), and 0.778 ppp (Florida). LSU claims the highest magnitude in the conference at 0.985 ppp.
STANDARD DEVIATION:
Kentucky's standard deviation is 0.126 ppp for this season, the third lowest standard deviation for the SEC this season. Vanderbilt claims the lowest ANE standard deviation for the season at 0.115 ppp,, and Mississippi is second in this category at 0.125 ppp. The largest standard deviation in the SEC belongs to Florida at 0.207 ppp. Auburn is fourth at 0.130 ppp and Tennessee finishes 11 th at 0.164 ppp. The SEC average standard deviation is 0.154 ppp.
VARIANCE:
Some argue that standard deviation may not be as useful for comparing teams, and a better comparative measure is variance, i.e. standard deviation expressed as a percentage of the team's average. In this case, Kentucky is second at 64.95% to Auburn's 58.44%. The highest variance belongs to Mississippi (192.79%), and Tennessee (69.84%) and Florida (104.53%) are 4 th and 7 th respectively.
OVERALL CONSISTENCY:
Kentucky is # 2, #3, and #2 in the three proposed measures of consistency (inconsistency) for the 2017-18 season. Averaging the rank of all three methods yields an average o. 2.33 for the Cats, which is the lowest overall average of the three methods, followed by Auburn (3.33) and Vanderbilt (3.67). Thereafter, the average ranking drops substantially to the group headed by Mississippi and Mississippi State at 6.33 each. The least consistent SEC teams have been LSU, Florida, and Alabama.
Submitted by Richard Cheeks
Submitted by Richard Cheeks
![]()
To Cats Face Georgia in SECT Quarterfinal
Go Back
To Cats Close Out Season As a "No-Show" at Florida
Copyright 2018
SugarHill Communications of Kentucky
All Rights Reserved