BIG BLUE FANS FOR
![]()
BASKETBALL
PROBABILITY OF WINNING
THE NCAA TOURNAMENT
FUNCTION OF RANK OF
ADJUSTED NET EFFICIENCY (ANE)
BASED ON RESULTS SINCE 2002
For several years, it has been clear that a team's ability to win the NCAA basketball tournament is a function of that team's Adjusted Net Efficiency (ANE). Data is available for all seasons since 2002, and these 17 champions have had the following final ANE rank distribution.
ANE Number
Rank Champions
ANE Rank |
Number of Champions |
1 |
9 |
2 |
3 |
3 |
0 |
4 |
1 |
5 |
1 |
6 |
0 |
7 |
0 |
8 |
1 |
9 |
1 |
10 |
0 |
The number 1 ranked team, using ANE as the ranking criteria, has won 9 of these 17 championships, and the number 2 ranked team has won another 3 championships. The remaining 4 champions had ranks of 4, 5, 8, and 9. Clearly, the sample size is too small to take this data on its face. The probability that a #3 team will win is clearly not 0%, and similarly for 6, 7, 10, and even the remainder of the NCAA field. Therefore, some manipulation of this limited sample is necessary to distribute the probabilities for the entire 68 team Tournament Field such that it continues to reflect the basic top heavy relationship and the sum of all 68 probabilities is 100%.
This analysis results in the following distribution:
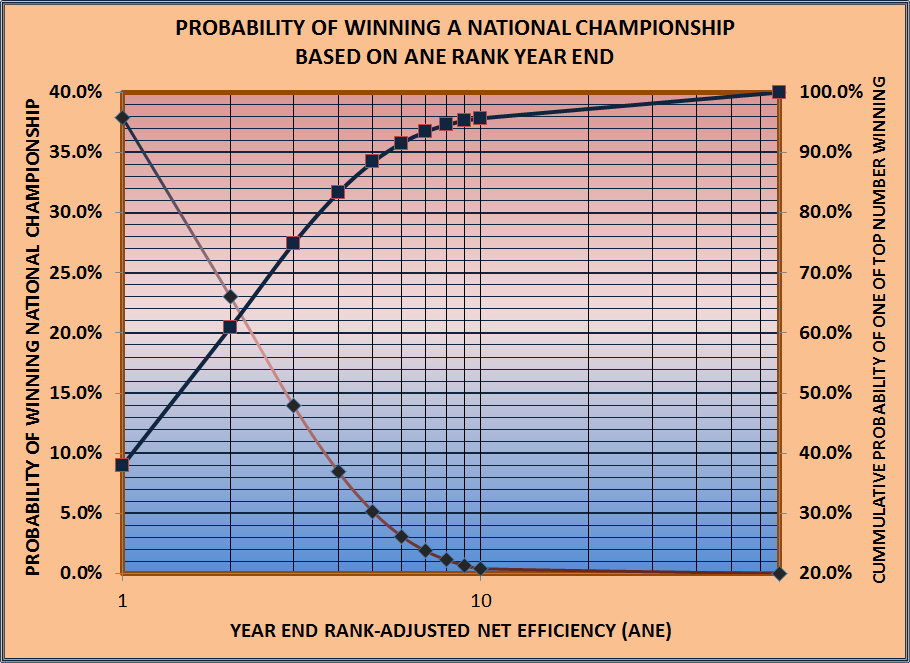
The data and analysis of the data are clear. I want my team to be the #1 ANE in the nation, and if not #1, then #2. After that, I want to be in the top 5. Given the distribution, anything outside the top 10 has no realistic chance to win the tournament.
The above data is presented in the next series of tables providing more detail in two respects. First, the tables examine more categories of statistics, and second, the data is sorted based on the following factors, in the order shown below:
1. Pace values will be lower, by the number of offensive rebounds.
2. Efficiencies will be higher due to the lower number of total possessions
3. Turnover rates will be higher due to the lower number of possessions.
CHECK OUT THESE OTHER ANALYTICAL WRITINGS
Change in Position on Definition of Possessions
Do Objective Performance Measures Like ANE
Account For Intangible?
Copyright 2008-19
SugarHill Communications of Kentucky
All Rights Reserved