BIG BLUE FANS FOR

BASKETBALL
ANALYSIS OF THE GAME OF BASKETBALL
How Have The NGE Predictions Performed
In The 2006-07 Out Of Conference Schedule
Now that the fourteen out of conference games for the 2006-07 season are in the book, and this season is basicly half done, how have the predicted and actual scores for UK and its opponents, and the predicted and actual game margins fared thus far?
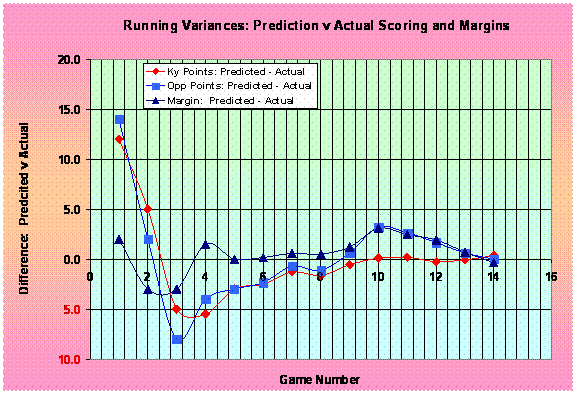
The graph below presents the running average point differentials for these 14 games for UK , its opponents, and margins of victory or defeat. When the season begins, all predictions are based solely upon each team's respective performance during the prior season, and any exhibition games for which data was available at the time of the prediction. As the graph illustrates, the predicted scores for game 1, both UK and Miami , were overstated by 12 and 14 points respectively. As teams generated data for this current season, the model's effectiveness improved rapidly and the average differentials between predicted and actual scores declined from these high game one results, dipped below zero, and then rebounded, approaching an average differential of about zero. This trend is also present in the predicted and actual scoring margins, but the magnitude of these swings is subdued by the model's ability to predict the margins more accurately than the actual individual team scores.

The scoring differential for UK leveled out by about game 9 or 10, but at games 9 and 10, something happened to drive the differential for both the average opponent scoring up [Opponents scoring less than predicted] and the average margin up simultaneously [UK generating larger margins than predicted].
This anomaly in the trends begs the question of why has this occurred? Games 9 and 10 are the UK-IU and UK-UL games. Both of those two games were marked by a convergence of two unusual circumstances. IU and UL both manhandled UK on the offensive boards, each generating double digit bonus possessions in their games over UK and each of these opponents could not throw the ball in the ocean from the beach, with IU hitting only 4 of 25 three point attempts and UL only hitting 3 of 24 three point attempts. The combination of 11 to 12 more possessions and the anemic three point shooting produced defensive efficiencies that were not only exceedingly low, but not representative of the UK defensive efforts. As a result, in those two games, the opponent scoring was much less than the NGE model had predicted.
Those “stellar” defensive performances have also affected future game predictions because future game predictions are based on the average offensive and defensive efficiencies of each team considering all games played immediately prior to the actual game. The impact of the IU and UL games was to decrease the average UK defensive efficiency artificially. Therefore, in the last four games, those played since the IU-UL tandem, the NGE model has over predicted the UK margins by under-predicting Opponent scoring. The differential between predicted and actual opponent scoring in these last 4 games has been 3, 9, 12, and 8 points [average 8 points per game] and the differential between predicted and actual margins have been 4, 4, 14, and 14 [average 9 points per game]. With respect to the UK scoring, predicted v actual during those same four games, the differentials have been 1, -5, 2, and 6 [average +1 point per game] which is consistent with the scatter that usually has occurred between these predictions and the actual scoring.
As this graph indicates, the year-to-date average differentials for all three of these values have returned to zero. At this point, I am not sure how to interpret the current state of these data. Does the data indicate that the impact of the back-to-back anomalous games has now been corrected, and the model will return to its usual past performance levels or whether additional adjustment? Does the data indicate that the correction is still in process and the opponent scoring and margin curves must move into the negative side of the curve before they return to a near zero position and stabilize?
The Ole Miss game on Saturday may provide an indication of what that answer may be. The NGE model, based on current data for UK and Ole Miss indicate a seven point UK win on the road, 73-66. If things have stabilized, I would expect the actual scoring to fall within a relatively close band on either side of this prediction for both teams, say UK 69-77 points and Ole Miss 62 to 70 points, with UK having a relatively high probability of winning this game. However, if the opponent scoring and margins continue the recent trend [+8 and -8 points, respectively] then the modified predicted score would be Ole Miss winning 74-73, with the range of likely scoring becoming UK 69-77 points and Ole Miss 70-78 points. Therefore, if Ole Miss scores 71 or more points Saturday against UK , I will conclude that the recent predictive inaccuracies continue to play out.
Submitted by Richard Cheeks
Copyright 2006
SugarHill Communications of Kentucky
All Rights Reserved