BIG BLUE FANS FOR
![]()
BASKETBALL
All regular readers of BBF4UK.com know that I have tracked and analyzed basketball team efficiencies on a continuous basis since the early 1990s when Coach Pitino occupied the head coach's office at Memorial. My operating thesis has been the ability to compare teams head to head, both in the same season as well as season to season.
This thesis is not without a basis. Ken Pomeroy has tracked team efficiencies since the 2002 season, and the 14 champions in that span have ended the season with the best Adjusted Net Efficiency (ANE) 7 times, the second best efficiency 3 times, the third to fifth best efficiency 2 times. Two of these champions did not have a top 5 ANE, and both are Connecticutt teams to are the exceptions to the general rule who caught fire in the post season to remain standing on the first Monday night of April in 2011 and 2014 finishing their seasons with the 9th and 8th best ANE respectively.
| 2002 | 2003 | 2004 | 2005 | 2006 | 2007 | 2008 | 2009 | 2010 | 2011 | 2012 | 2013 | 2014 | 2015 | 2016 |
| MD | Syra. | Uconn | UNC | Florida | Florida | Kansas | UNC | Duke | Uconn | Kentucky | Louisville | Uconn | Duke | Villanova |
| 2 | 5 | 2 | 2 | 1 | 1 | 1 | 1 | 1 | 9 | 1 | 1 | 8 | 4 | 1 |
The bottom line is a top 10 ANE is necessary to win the NCAA Tournament, a top 5 ANE will win the vast majority of the championships, and the most efficient team has won over 50% of the time. That is why I want my team to be the most efficient team in the land, and if not #1, then #2, then top 5, and if not top 5, than no worse than top 10.
About 5 years ago, I began to apply the macro analysis of team efficiency on the micro level of individual player efficiency. The methods have evolved since 2010, but the refinements that have occurred have had only marginal impact upon the final Individual Net Efficiency (INE) for a player in a given season.
OFFENSIVE FACTORS:
At the offensive end of the court, I started with a Raw Scoring Efficiency for each player based on points scored per scoring opportunity. A scoring opportunity is a shot taken or a free throw opportunity [1, 2, or 3 free throw attempts]. However, we all understand that an offensive rebound continues a possession after a missed shot, to some extent obviating the impact of the missed shot, and a turnover ends a possession, eliminating an opportunity to take a shot. Therefore, I adjusted the scoring opportunities by crediting a player a full possession used for an offensive rebound and debiting a player a full possession used for a turnover. Finally, many scores result from the assist of a teammate. It seems unfair to give the scoring player full credit for the score when he benefits from the sacrifice of his teammate for the benefit of the team. Therefore, I adjusted the points scored by crediting the assist makers a portion of basket for each assist, and debiting all of the assist recipients those same points distributed on a proportional basis using the total points scored by each player.
DEFENSIVE FACTORS:
On the defensive end, I started the analysis from a premise that unlike offensive productivity, defensive productivity is a result of team effort . Therefore, each player starts the analysis with a presumption that he contributed equally to the overall team defensive efficiency. However, blocked shots and steals are clear factors that distinguish one player from another on the defensive end of the court. In the same manner as the adjustment on the offensive end for assists, I made adjustments on the defensive end for blocks and steals.
INDIVIDUAL NET EFFICIENCY [INE]:
The best measure of efficiency for a team is the ANE, as discussed in the introduction to this analysis. For similar reasoning, it is my opinion that INE provides a reliable and reasonable measure for individual players' seasons. Please note that the analysis, at least to this stage of its development, does not attempt to adjust year to year for the difficult of the schedule. Furthermore, those players that only enter games when the decision is already established are analyzed using the same protocols as players that play the vast majority of the minutes even though the former tend to play against weaker opponents that are tired and the latter play against all opponents at their best.
Admittedly, the inability to factor the INE for the strength of opponents is a weakness that limits comparision of players on the same team in the same season. To compensate for this effect, a subset of each UK roster includes those players that have played sufficient minutes and in sufficient games to establish that player as a regular rotation player. Furthermore, it is clear that comparision of players' INE from different seasons that have different strength of opponents has inherent flaws.
PLAYER RANKINGS FOR 119 UK PLAYERS; 1996-2016:
I have applied the same analysis to the rosters of the 1996 through 2016 UK teams.
One hundred nineteen players appear in the year ending box scores over the subject 20 seasons. The data provided in Table I represents each of these players' full UK career except for those players that appear on a 1996, 1997, or 1998 roster who also played in 1995 or earlier. I could not include any data prior to 1996 because the statistical archives for those prior years do not include offensive rebounding data, an essential component of the INE analyses.
Table I includes 3 separate methods of ranking individual players. Initially, I simply averaged the year ending individual NGE values for each player. However, this method produced some unexpected outcomes primarily because a few players had 1 season out of 3 or 4 that were so anomalous to their overall UK career that distorted the final result when that season received equal weight with the other 2 or 3 seasons for those few players. For example, Jodie Meeks played 3 seasons, and his second season was marked by serious injury. Despite his injury, Meeks tried to play in several games that season. As a result, his NGE value for 2008 was much poorer than his other two UK seasons.
Therefore, I added two additional methods of ranking, one weighted by the number of games played in each active season and the other weighted by the number of minutes played in each active season. Table I contains all three ranking systems, and is sorted based on the ranking that the game weighting system produces.
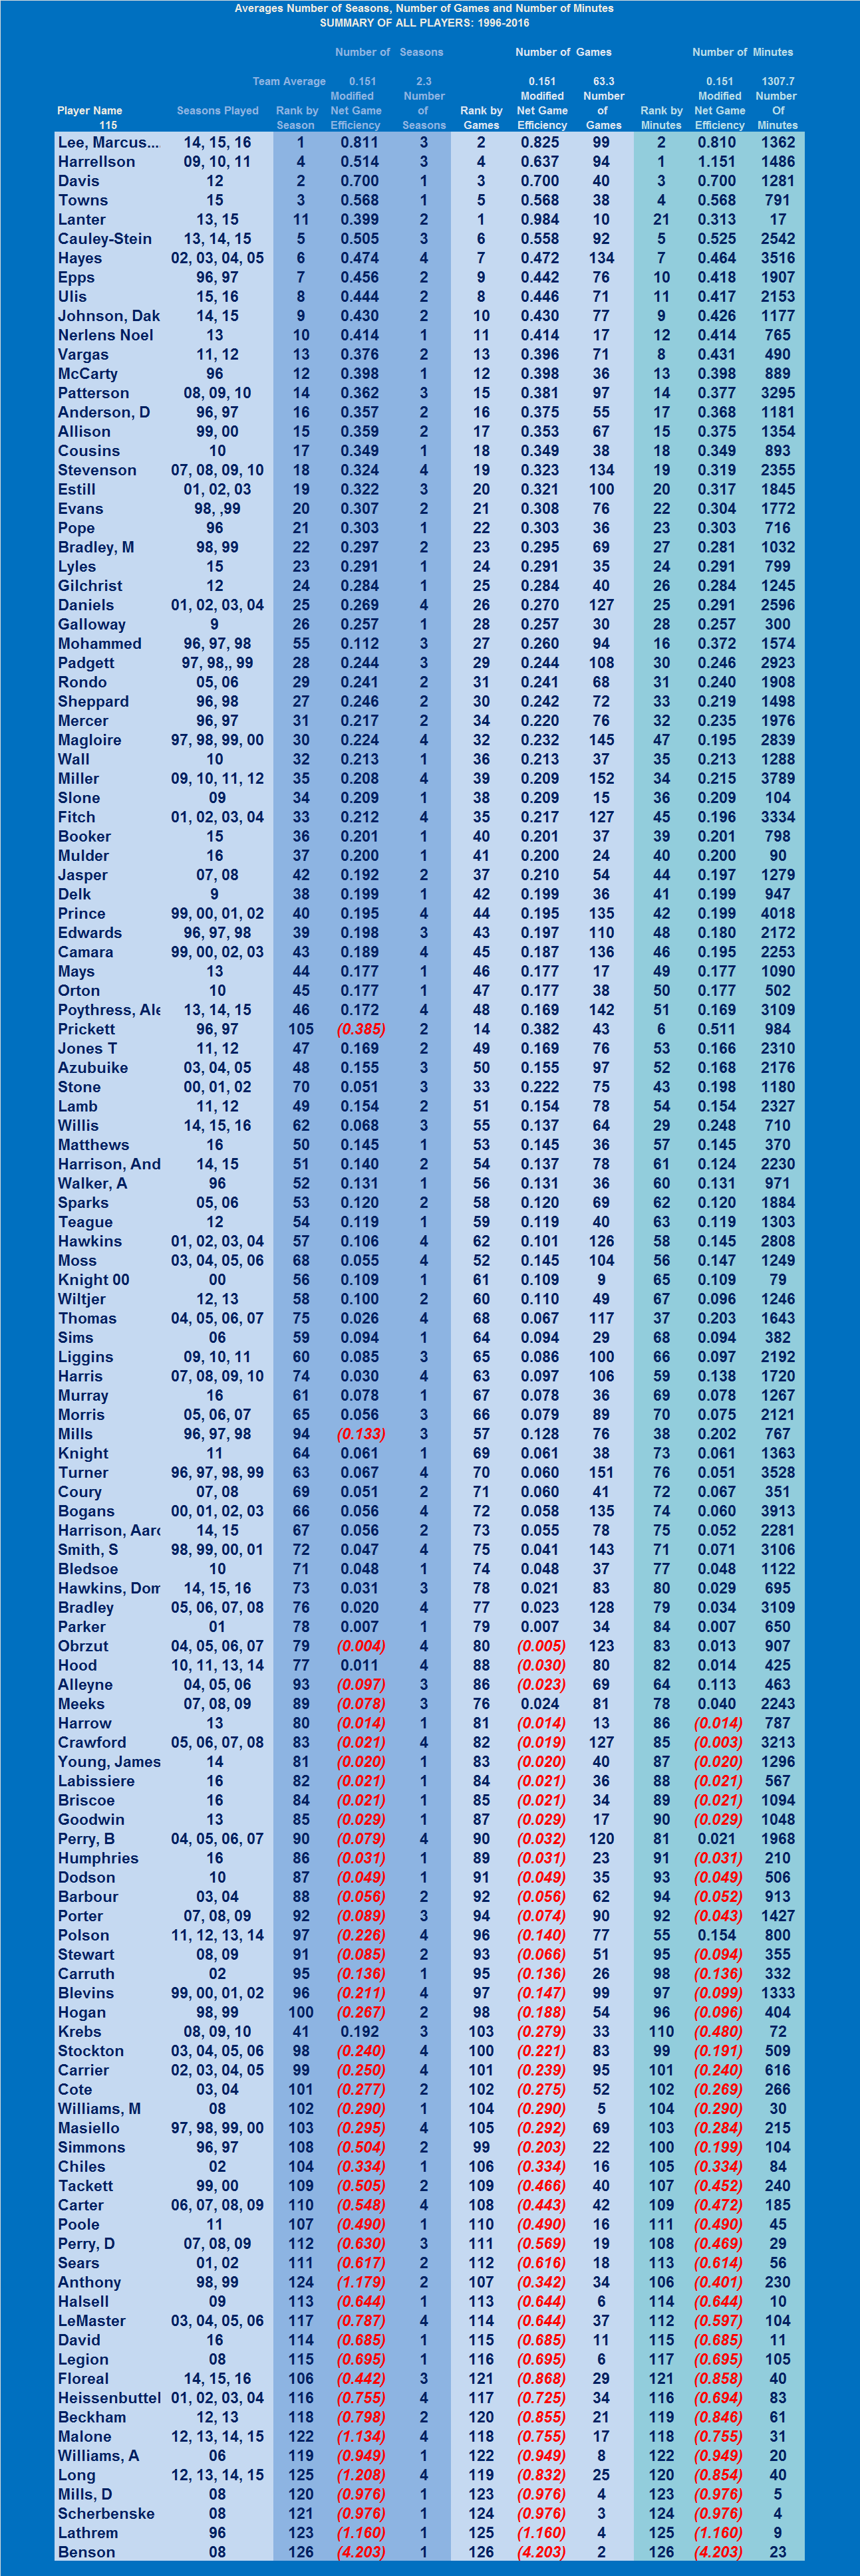
TABLE I
INDIVIDUAL EFFICIENCY SUMMARY
ALL 119 PLAYERS SINCE 1996
(To View Table in Larger View, Click on Table)
COMPARISON WITH PRIOR UK TEAMS:
To compare these 20 UK teams, I have summarized each team by tabulating the distribution of individual NGE for each team to provide an efficiency profile for each team. I have also included the final offensive, defensive and Net Efficiencies (Not Adjusted for Schedule Strength) for each respective team. I direct your initial attention to the team data in the center portion of Table II. Notice that the team NGE for 1996 and 1997 were 0.282 ppp and 0.260 ppp respectively. No UK team since has had a NGE above 0.200 ppp.
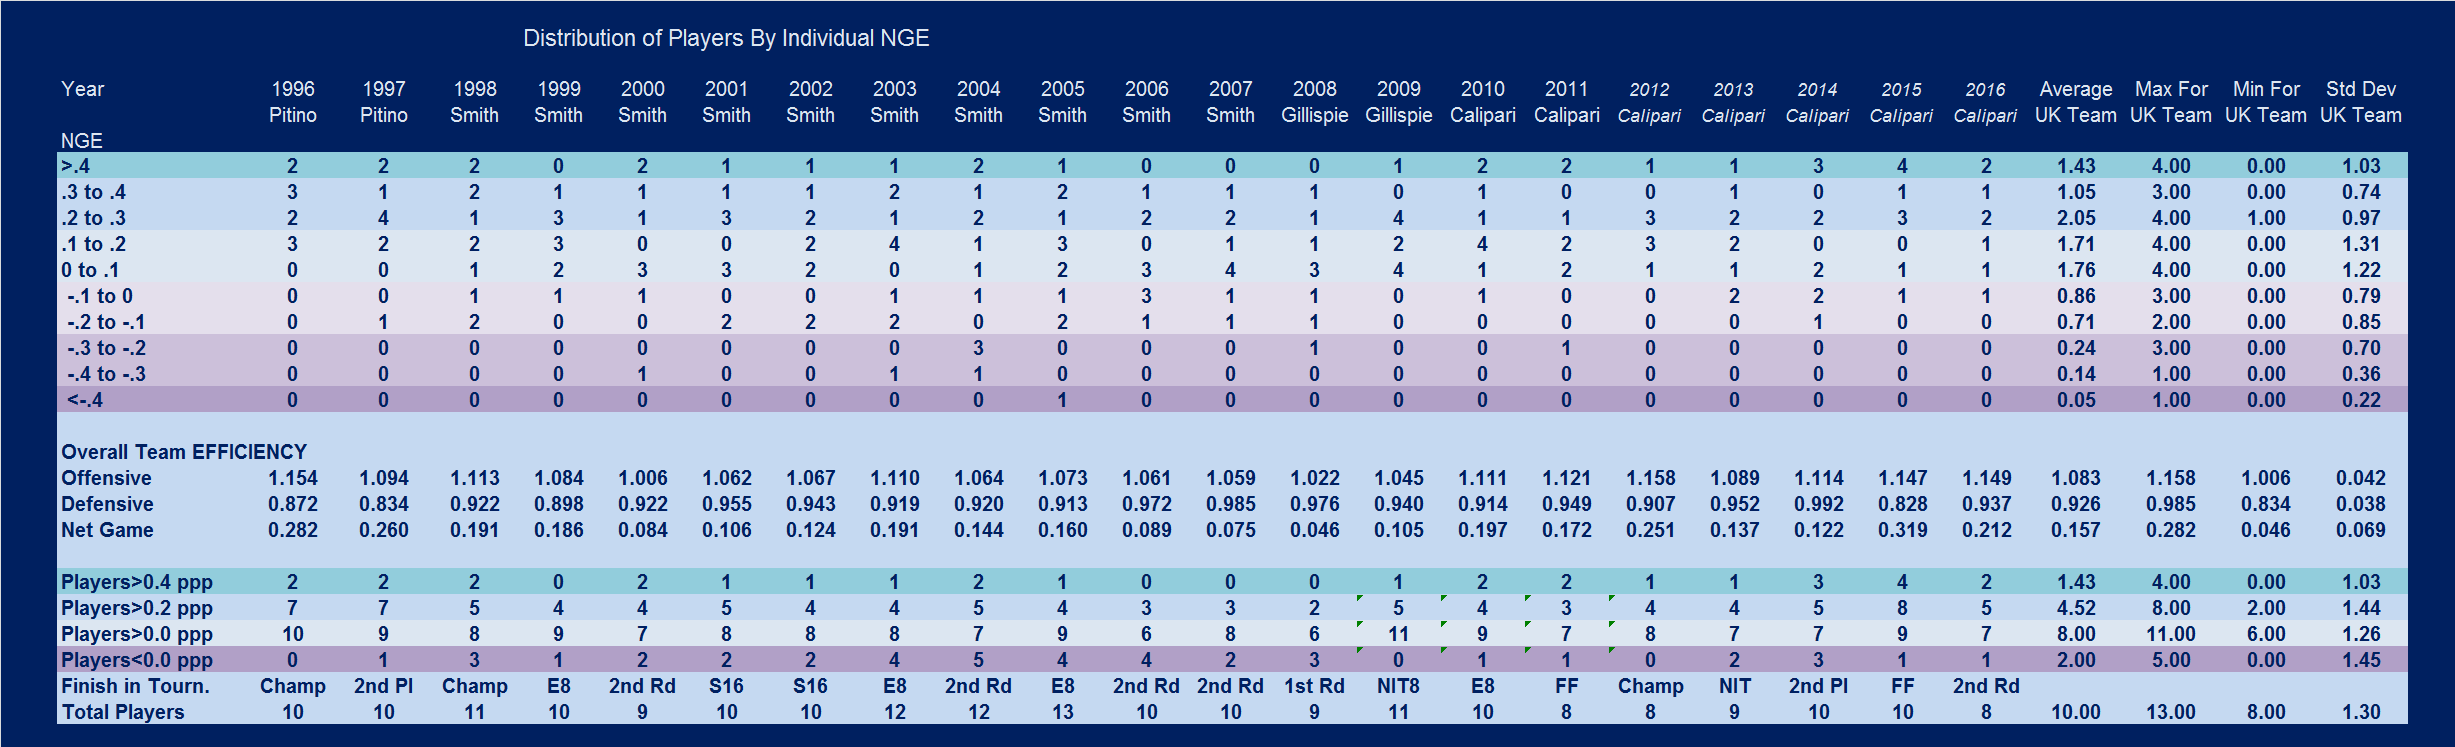
TABLE II
INDIVIDUAL EFFICIENCY SUMMARY
ALL UK TEAMS SINCE 1996
Players 100+ Minutes and Played in more than 50% of all Games
(To View Table in Larger View, Click on Table)
The 2015 team has the highest Net Efficiency [0.319 ppp], surpassing the 1996 (0.282 ppp) and 1997 (0.260 ppp). The 2012 Champions ended the season at 0.251 ppp. No other UK teams since 1996 ended the season with a Net Efficiency over 0.200 ppp. The team profiles presented in these distributions do not include players that did not play sufficient games or minutes to significantly impact the team outcomes. The criteria for inclusion is a player had to play at least 100 minutes AND appear in over 50% of all games during the entire season.
Now, I direct your attention to the top ½ of Table II and the distribution of players by their individual NGE values for each cited season. This distribution ranges from a high of 0.4 ppp or higher and a low of -0.4 ppp or lower, with 0.10 ppp increments between these extremes. The distributions of the 1996 through 2015 teams appear in those respective columns of Table II. At the bottom 1/3 of Table III is a recasting of the basic team profiles, showing Cumulative totals for players with positive and negative INE values.
COMPARISON WITH PRIOR NCAA CHAMPIONSHIP TEAMS:
Table III provides a summary of the individual player INE for 1996 through 2010 for 12 of the 15 National Champions over that 15 year period for comparison purposes. This Table results from the same analysis described above. No data is available for the 1997 Arizona, 1999 UConn, and 2002 Maryland teams to perform the analysis. Therefore, those columns are empty.
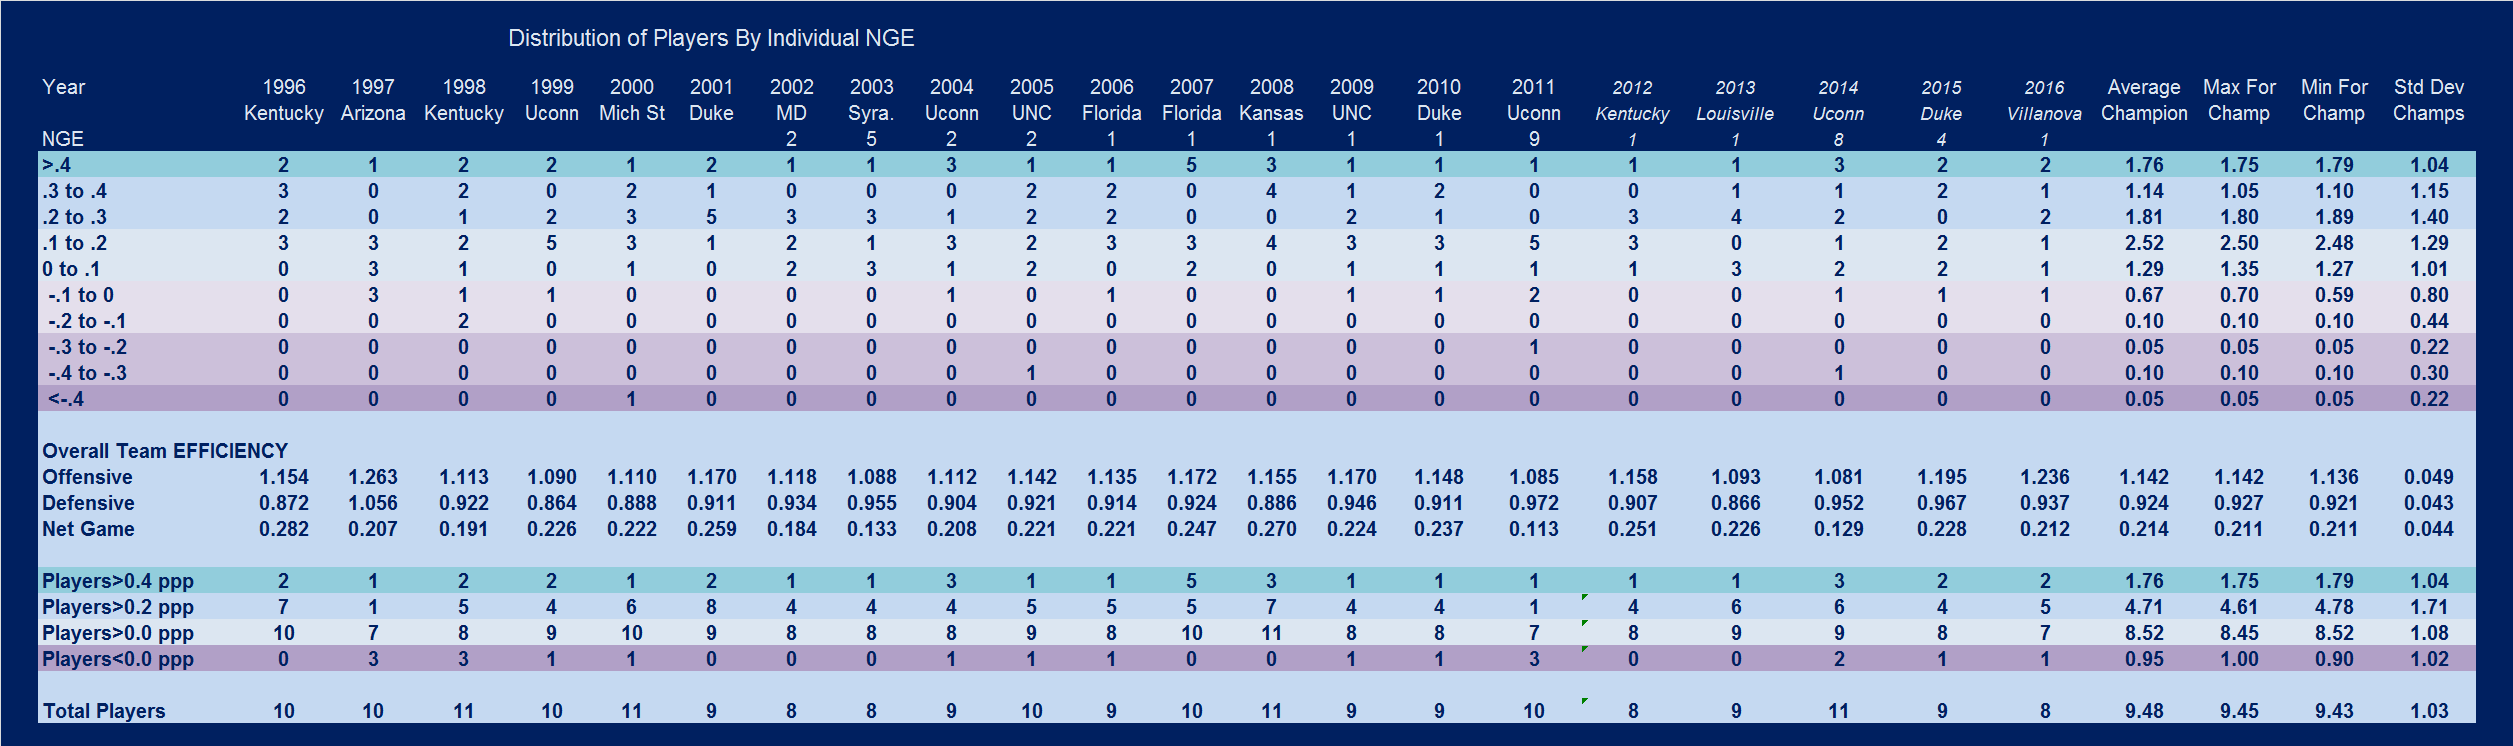
TABLE III
Distribution of Individual NGE for NCAA National Champions
1996 Through 2010
Players 100+ Minutes and Played in more than 50% of all Games
(To View Table in Larger View, Click on Table)
I did add 4 columns to Table IV to present the mean and ranges of results achieved by these 20 champions. As noted above, please note that these Championship teams posted team NGE values that averaged 0.214 ppp, and that the 1996 UK 0.280 ppp remains the Gold Standard among these 20 NCAA championship teams. However, the 2008 Kansas team's 0.270 ppp is clearly in that same rarified air. Furthermore, notice that the Championship teams have individual player profiles that are top heavy, with very few players in the negative NGE ranges. The average NCAA Champion has had almost 2 players at 0.4 ppp or higher, and less than 1 player with a negative NGE values. Four of these 20 champions had 2 or more players in the negative range: 1997 Arizona; 1998 Kentucky; 2009 UConn; and 2014 UConn. The other 16 NCAA Champions see eight with no below zero players and eight with only one such player.
These 20 Champions finished with team NGE values ranging from 0.113 ppp [UConn 2011] to 0.282 ppp [UK 1996] with a mean of 0.214. Fifteen of the 20 Champions had a season NGE above 0.200 ppp, and the mean of the 12 is 0.214 ppp.
I want my team to have an unadjusted Net Efficiency as high as possible, of course, but the floor for legitimate opportunities to win the championship seems to be 0.200 ppp.
COMPARISON OF UK COACHES WITH NCAA CHAMPIONSHIP TEAMS:
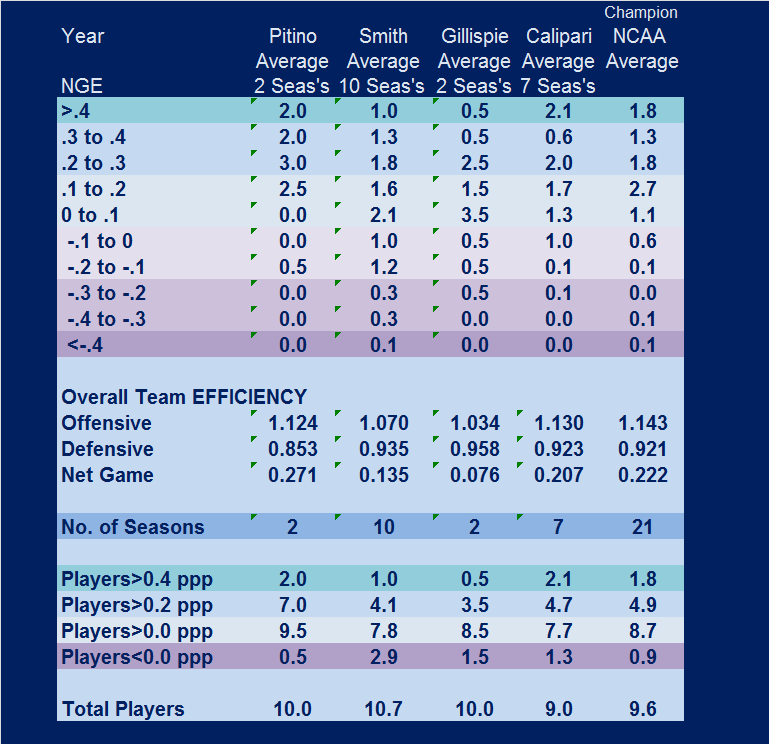
TABLE IV
Average UK Team Profiles by Head Coach & NCAA National Champions
1996 Through 2015
Table IV provides a summary average individual team NGE profiles, by Coach, for UK from 1996 through 2015, and for the 20 National Champions. While I would like to complete the Pitino profile by adding his 1992 through 1995 teams into this analysis, it is clear that the two Pitino teams included in this analysis establish the parameters of greatness when compared to the average NCAA Champions during this 20-year period. It is also clear that the average team profiles of the Tubby Smith teams do not compare favorably with the minimum criteria [Team NGE > 0.200 ppp; at least 2 players in the 0.4 or higher range, and no more than one player with a negative individual NGE value] for legitimate NCAA Championship teams.
It is equally clear that Calipari has returned the UK program to the national stage with 4 final fours and one championship in his first 6 seasons at UK.
Over the last 20 years, Kentucky, UConn, Duke, Florida and North Carolina have won 12 of the 20 championships, with Kentucky and UConn each claiming three, and the others getting two each.
CLOSURE:
This analysis of individual player efficiencies is clearly a new work in process, and I would not want anyone to misrepresent or overstate the significance of this early attempt to quantify the individual contributions to a team activity. Much more work will be required before any reliance upon this type of analysis of individual players can be reasonably justified. However, in my opinion, the use of the individual outcomes from this analysis to describe a team profile and evaluate that team relative to other teams in the same year, and prior years appears to have a solid foundation. I am encouraged by the results of this early analysis, even with the possible anomalies that occur within the individual player rankings. Therefore, I will continue this work into the future. I welcome comments and suggestions from those interested in this type of analysis.
Copyright 2015
SugarHill Communications of Kentucky
All Rights Reserved