BIG BLUE FANS FOR
![]()
 FOOTBALL
2016
![]()
GATEWAY TO THE 2016 SEC FOOTBALL SEASON
How Will The Cats Fare In 2016 With Their Football Season
(Revisited Based On 2016 Season Projections)
?
The following tables provide the pre-season projection for 2016 based solely on 2015 data for UK and each of its 2016 opponents, the 2015 pre-season forecast based solely on 2014 ending statistics, and the 2015 results after 12 games as compared to the 2015 pre-season forecast.
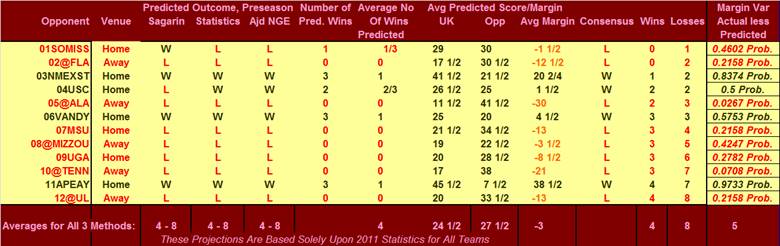
TABLE I
2016 PRE-SEASON FORECAST
BASED ON 2015 STATISTICS FOR ALL TEAMS
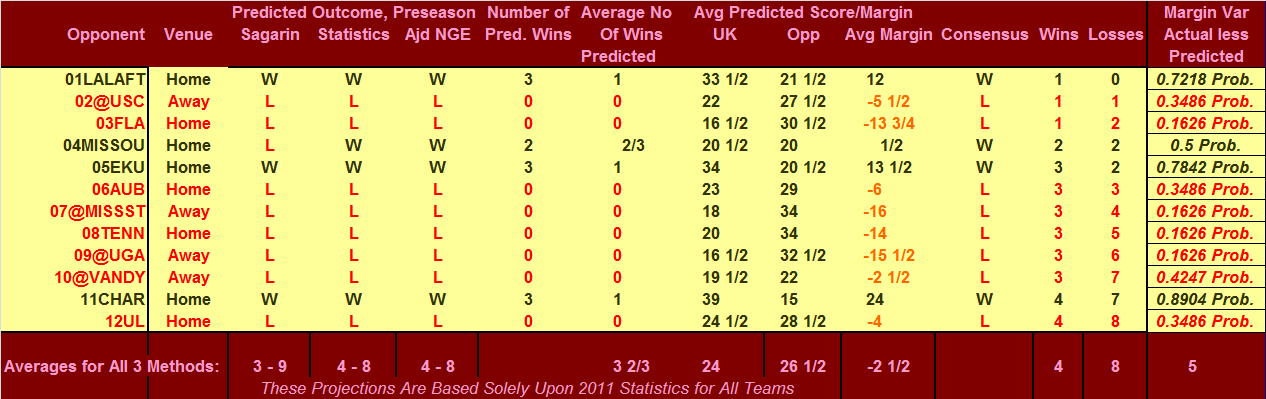
TABLE II
2015 PRE-SEASON FORECAST
BASED ON 2014 STATISTICS FOR ALL TEAMS
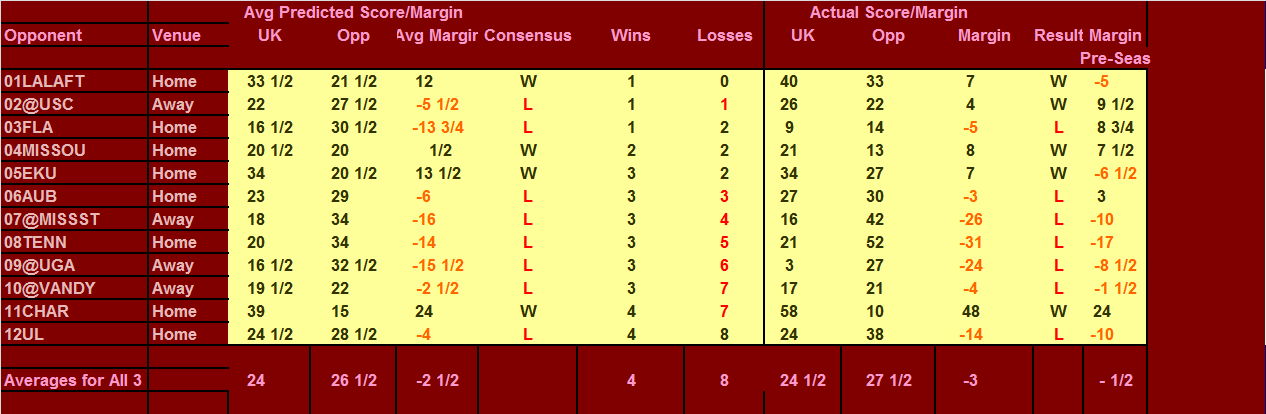
TABLE III
2015 PRE-SEASON FORECAST AND FINAL RESULTS
BASED ON 2014 PRE-SEASON AND 2015 SEASON STATISTICS FOR ALL TEAMS
Last year, this projection method forecast a 4-8 season in the pre-season, with UK averaging 24 ppg and yielding an average 26 ½ ppg. At the end of the 2015 season, UK had averaged 24 ½ ppg and had yielded an average 27 ½ ppg. The one game improvement from 4 wins to 5 wins is solely attributable to the win at South Carolina. However, given how South Carolina's season played out, that flip is as much or more attributable to the condition of South Carolina's 2015 team rather than a sea-level change on the part of the UK program, which actually slipped some in 2015. The forecast for 2016 indicates an average of 24 ½ ppg while yielding an average 27 ½ ppg, with a 4-8 record.
It is interesting to note the variation of actual margin from the pre-season predicted margins in 2015. These variations ranged from a high (good performance) of +24 (Charlotte) to a low (poor performance) of -17 (Tennessee). The 2015 Cats outperformed the model 5 times and underperformed the model 7 times, with an average variation for the season of -1/2 point per game. The Standard Deviation of the variances is 11 ½ points, and the Cats played 10 of the 12 games within +/- 1 SD Unit. Assuming a similar variation in performance levels in 2016, five of the 12 games will be in play. Of these, three games are projected losses, and three of these five games have projected margins between -3 ½ and +1 ½ points. In my opinion, these three very close matchups provide the most likely opportunities to swing an L to a W, or vice versa. Therefore, the likely final record, based solely on 2015 performance levels, is three wins to six wins, with four or 5 wins more likely.
This is why I believe the UK team must show significant improvement on offense and defense in 2016 to avoid results similar to 2014 and 2015.
To quantify the improvement that will be necessary to improve (or slip from) the four wins projected, consider the following:
• The performance levels of the 2011, 2012, and 2013 teams would produce 2 wins against the 2016 schedule.
• The 2015, as already established would yield the 4 wins, but a return to 2014 levels (0.982 ppp) would provide a 5 th win in 2016.
• The 2014 and 2015 Adjusted Net Efficiencies were 0.98 and 0.77 ppp, respectively. To get the all-important sixth win in 2016, the ANE must increase to at least 1.07 ppp, which is a very modest increase from the 2014 result.
• To get to a 7 th win in 2016, the team will need an ANE of at least 1.47 ppp, which would require an increase of 0.7 ppp over last year's result. Over the last 4 years, 2 to 5 teams in the SEC have posted improvements of 0.7 ppp or more, and UK was one of those teams between the 2013 and 2014 seasons.
• An eighth win would require performance in 2016 outside the one SD unit.
The really exciting news, in my opinion, for 2016 is IF the team could increase their ANE to 1.90 or higher, they could pick up not just 1 more win, but an astounding 3 more wins, for a 10-2 season.
Wow!
Is an ANE of 1.9 or higher possible coming off a 0.77 ppp season in 2015? I would say it is not likely, but it certainly is possible. That would require a single season improvement of 1.103 ppp from last year's results. Last year, Tennessee improved by 0.90 ppp from its 2014 result, and Mississippi improved 0.98 ppp over its 2014 result. However, in 2013 and 2014, two teams exceeded a 1.1 ppp single season improvement, and in 2012, one team improved by more than 1.1 ppp from the prior year.
Submitted by Richard Cheeks
![]()
To: Are 2016 Fortunes Really On Barker's Arm?
Go Back To:
What Does 2016 Hold For UK Football
![]()
GATEWAY TO THE 2016 SEC FOOTBALL SEASON
Copyright 2016
SugarHill Communications of Kentucky
All Rights Reserved