BIG BLUE FANS FOR
![]()
![]()
 FOOTBALL
2019
Coach Mark Stoops enters the 2019 Football Season
riding the crest of three consecutive bowl appearances
with excellent prospects to make it four in a row.
In the entire history of UK football, only one coach
has led UK football teams to four consecutive bowl
games (Rich Brooks 2006-09).
Coach Stoops can
match that record in 2019, a decade later. Noting that
Coach Phillips led the Cats to their 5th consecutive
bowl appearance in 2010.
Remember This Outcry early in the 2016 Season?
"Following Game Two's Embarrassing Loss
UK Coaches Decry UK'S Turnover Rate
For Good Reason"
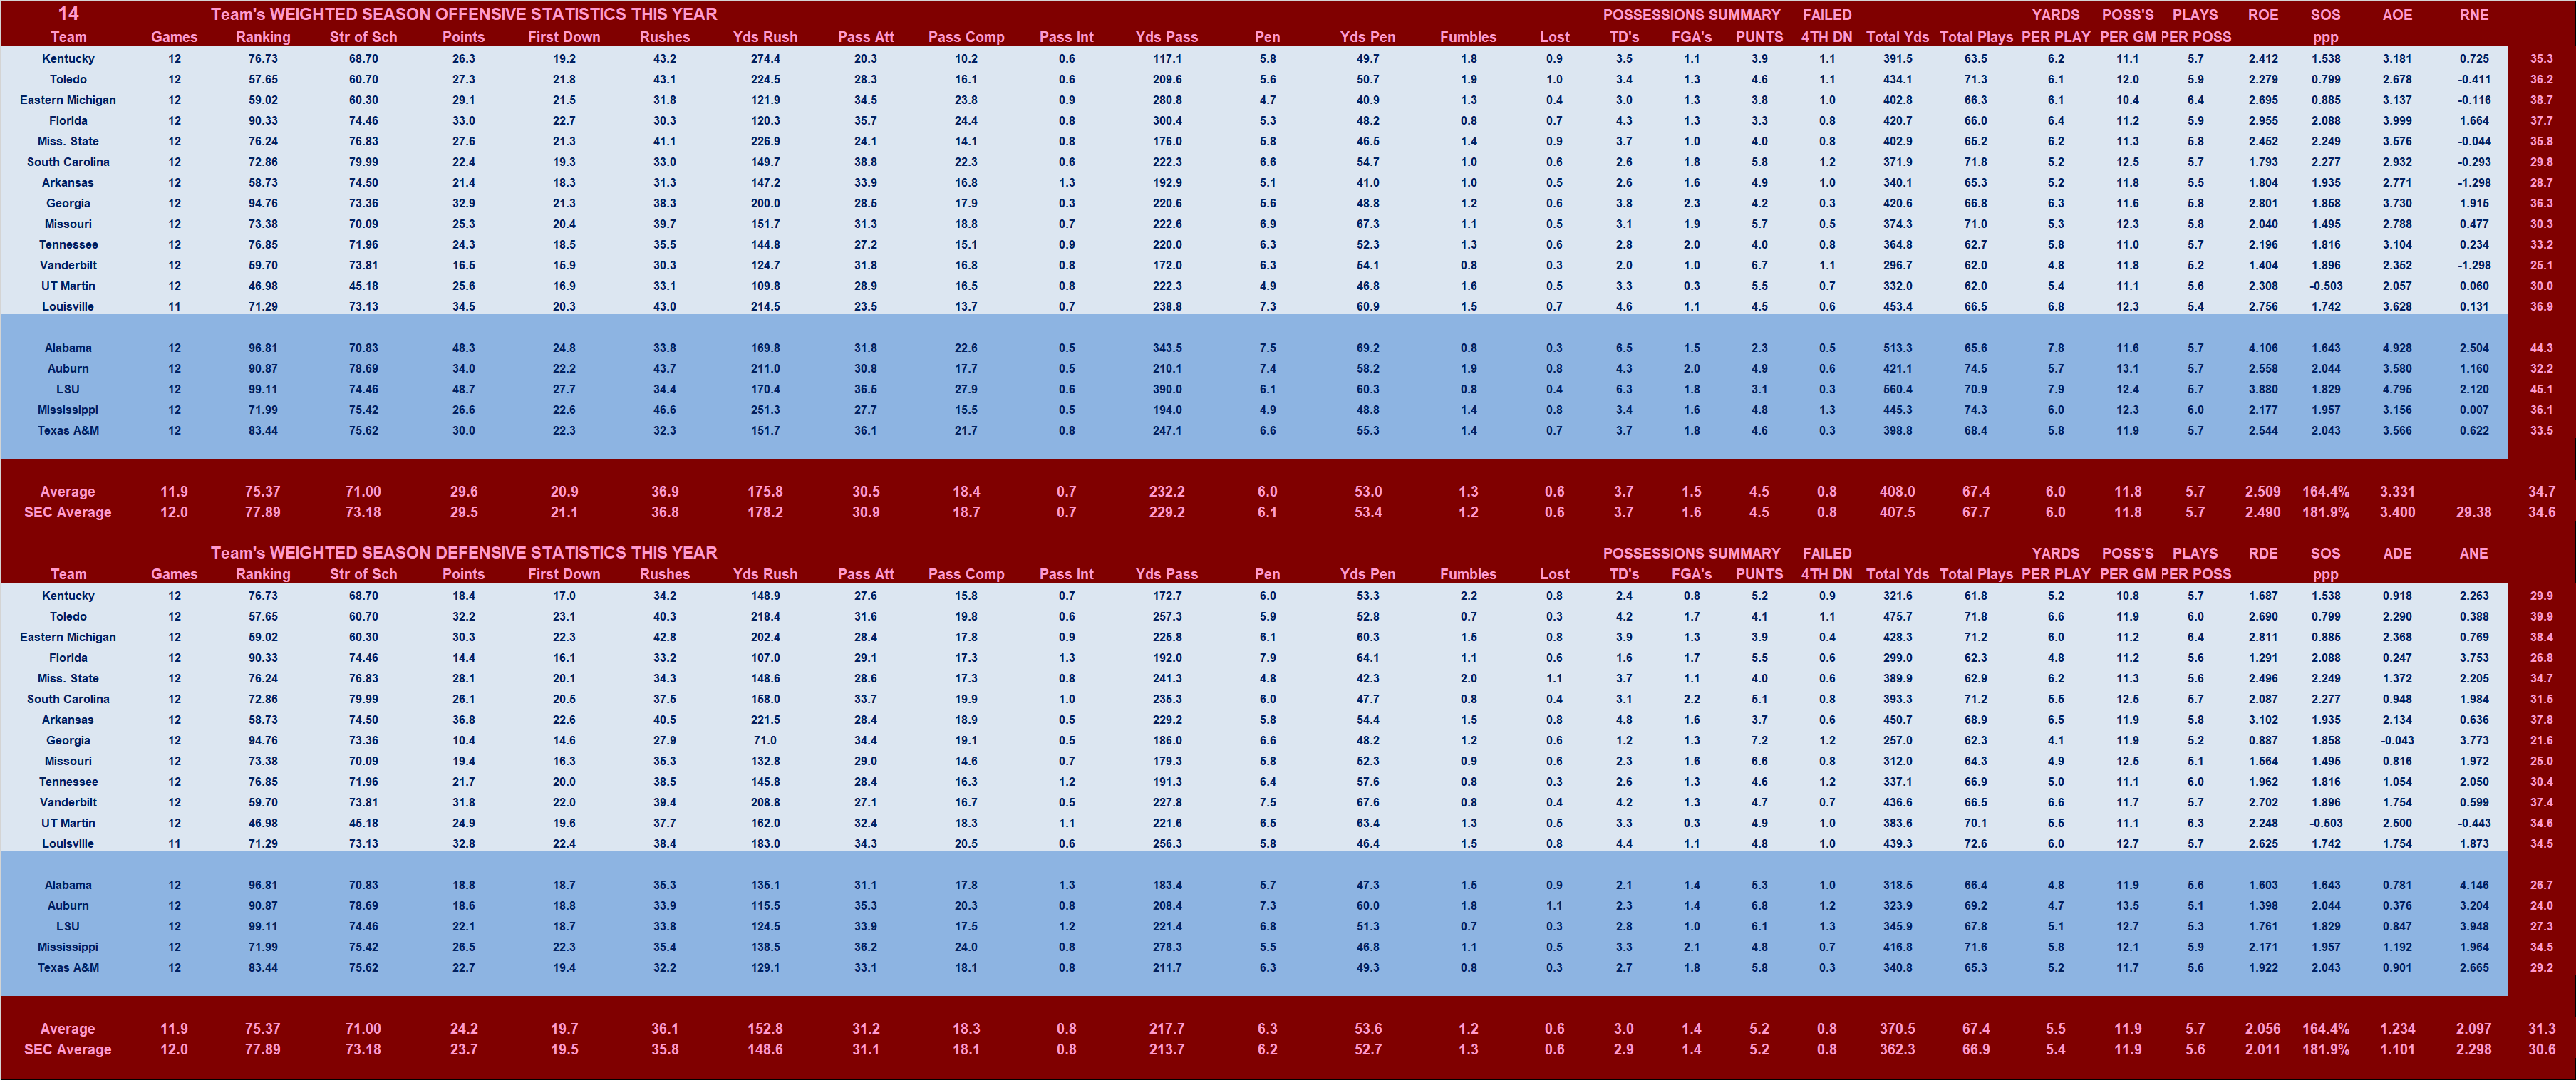
The 2017 Cats did a much better job protecting its possessions than the 2016 Cats had done.
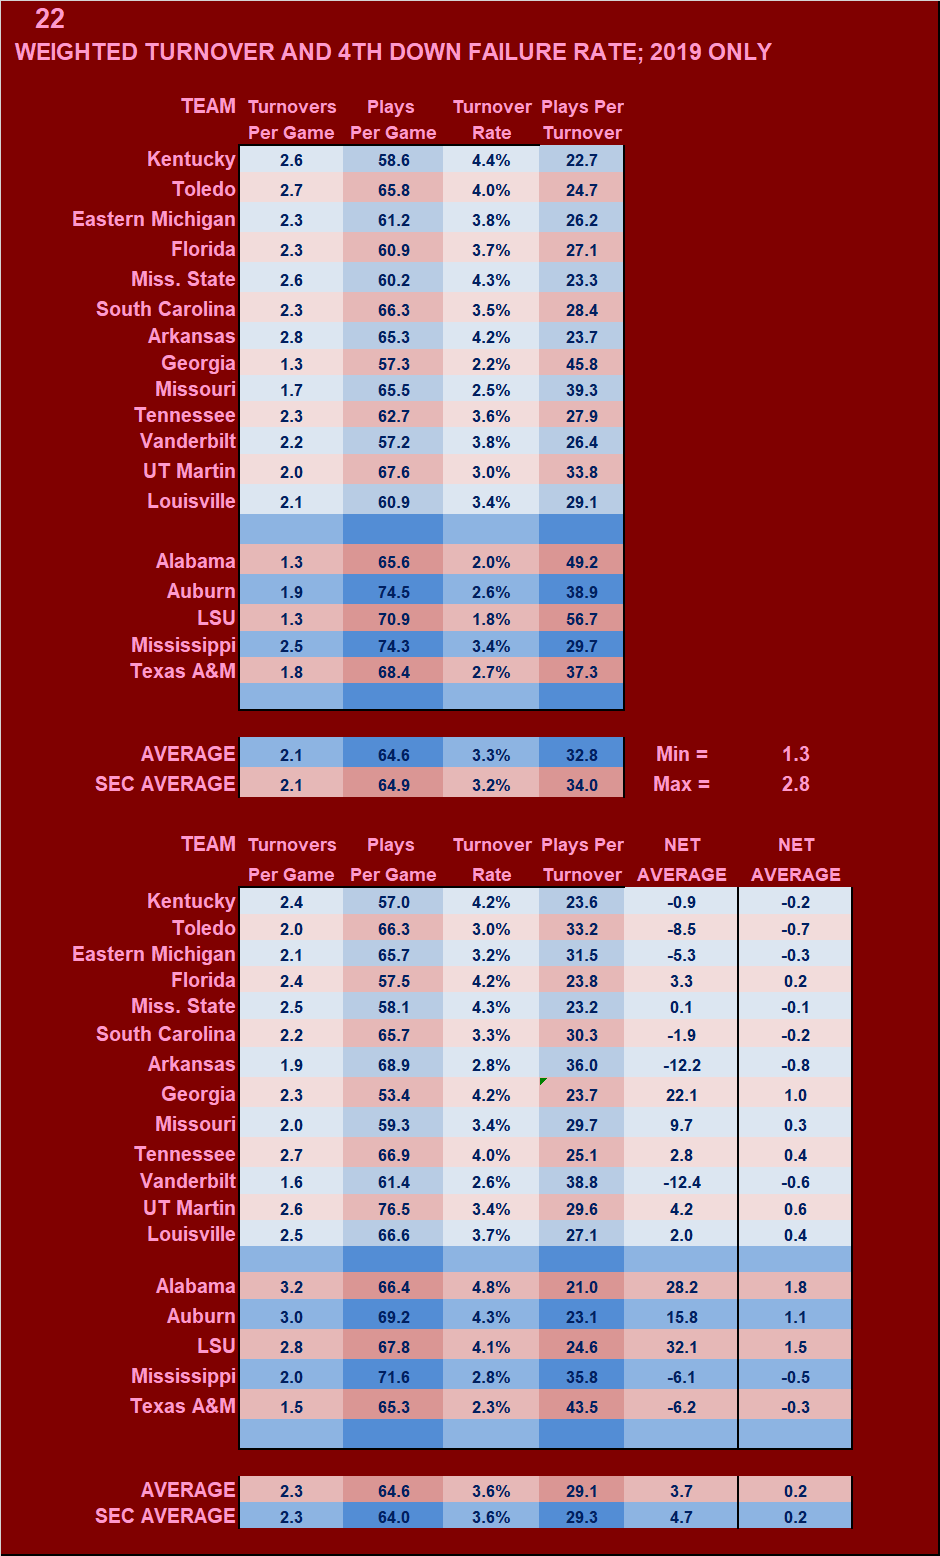
2019 Data
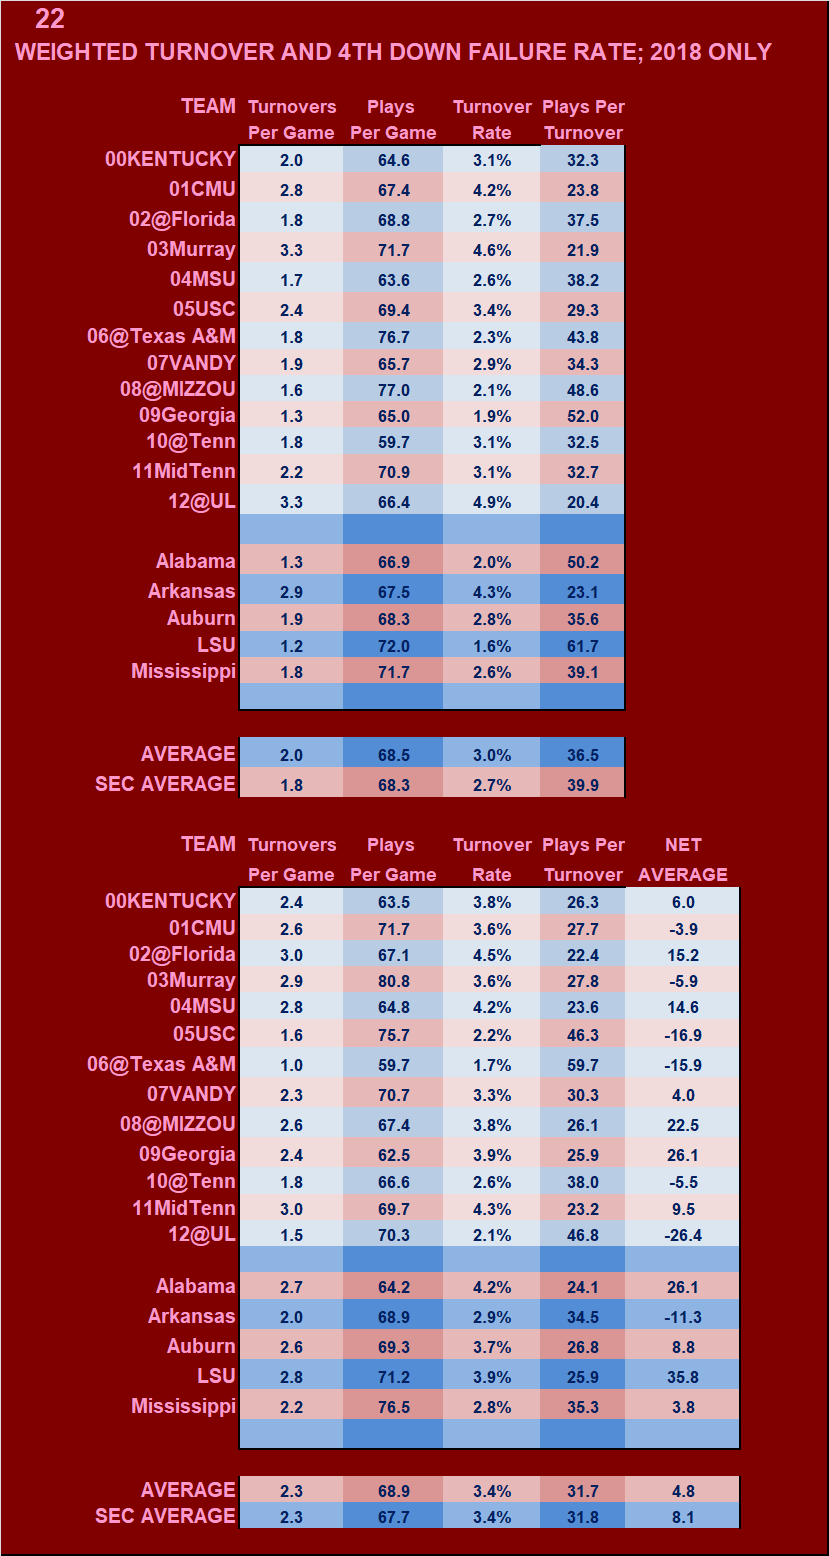
2018 Final Data
For an analysis of the 2017 Turnover Outcomes
CLICK HERE
Turnovers Kill Drives, Reverse Field Position, and Give Opponents Easy Points
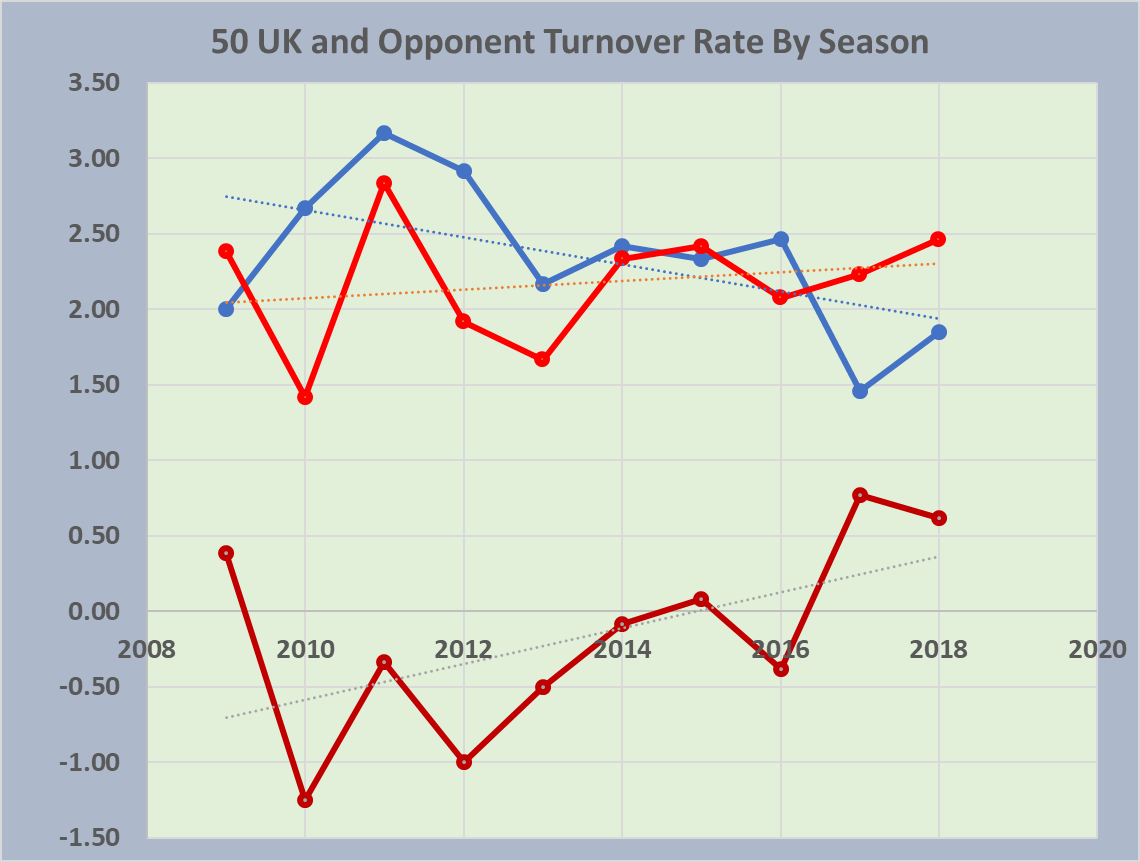
In 2018, Tennessee led the way with only 1.0 turnovers per game while South Carolina pulled up the rear at 3.5 turnovers per game.
The SEC average in 2018 was 2.0 turnovers per game.
In 2018, SEC Defenses averaged 2.2 forced turnovers per game, and
Mississippi led the way at 3.0 forced turnovers per game and Texas A&M was weakest in the SEC with 1.2 forced turnovers per game.
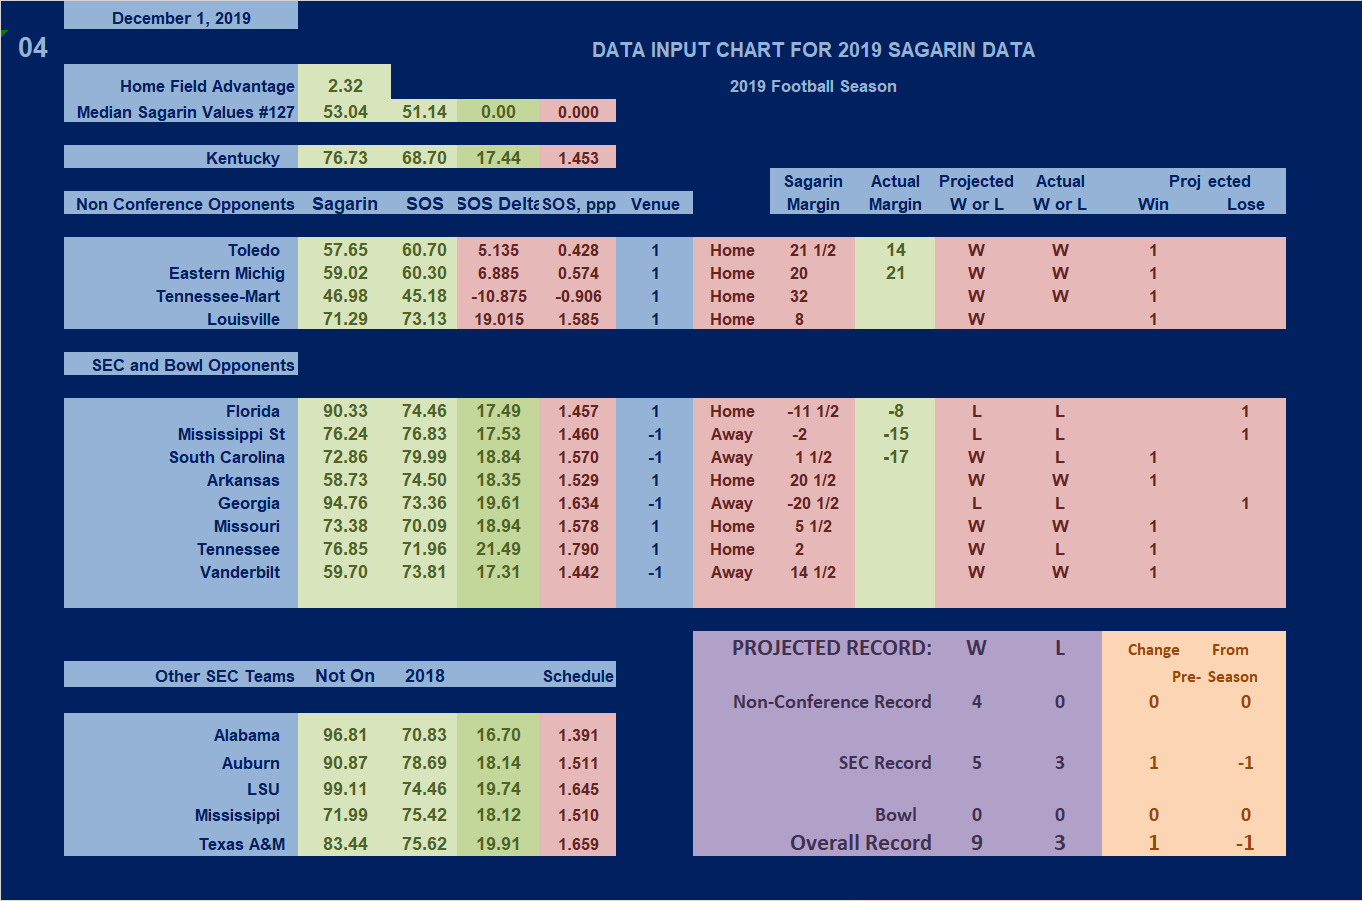
UK SEASON RESULTS AND
PROJECTIONS FOR REMAINING GAMES
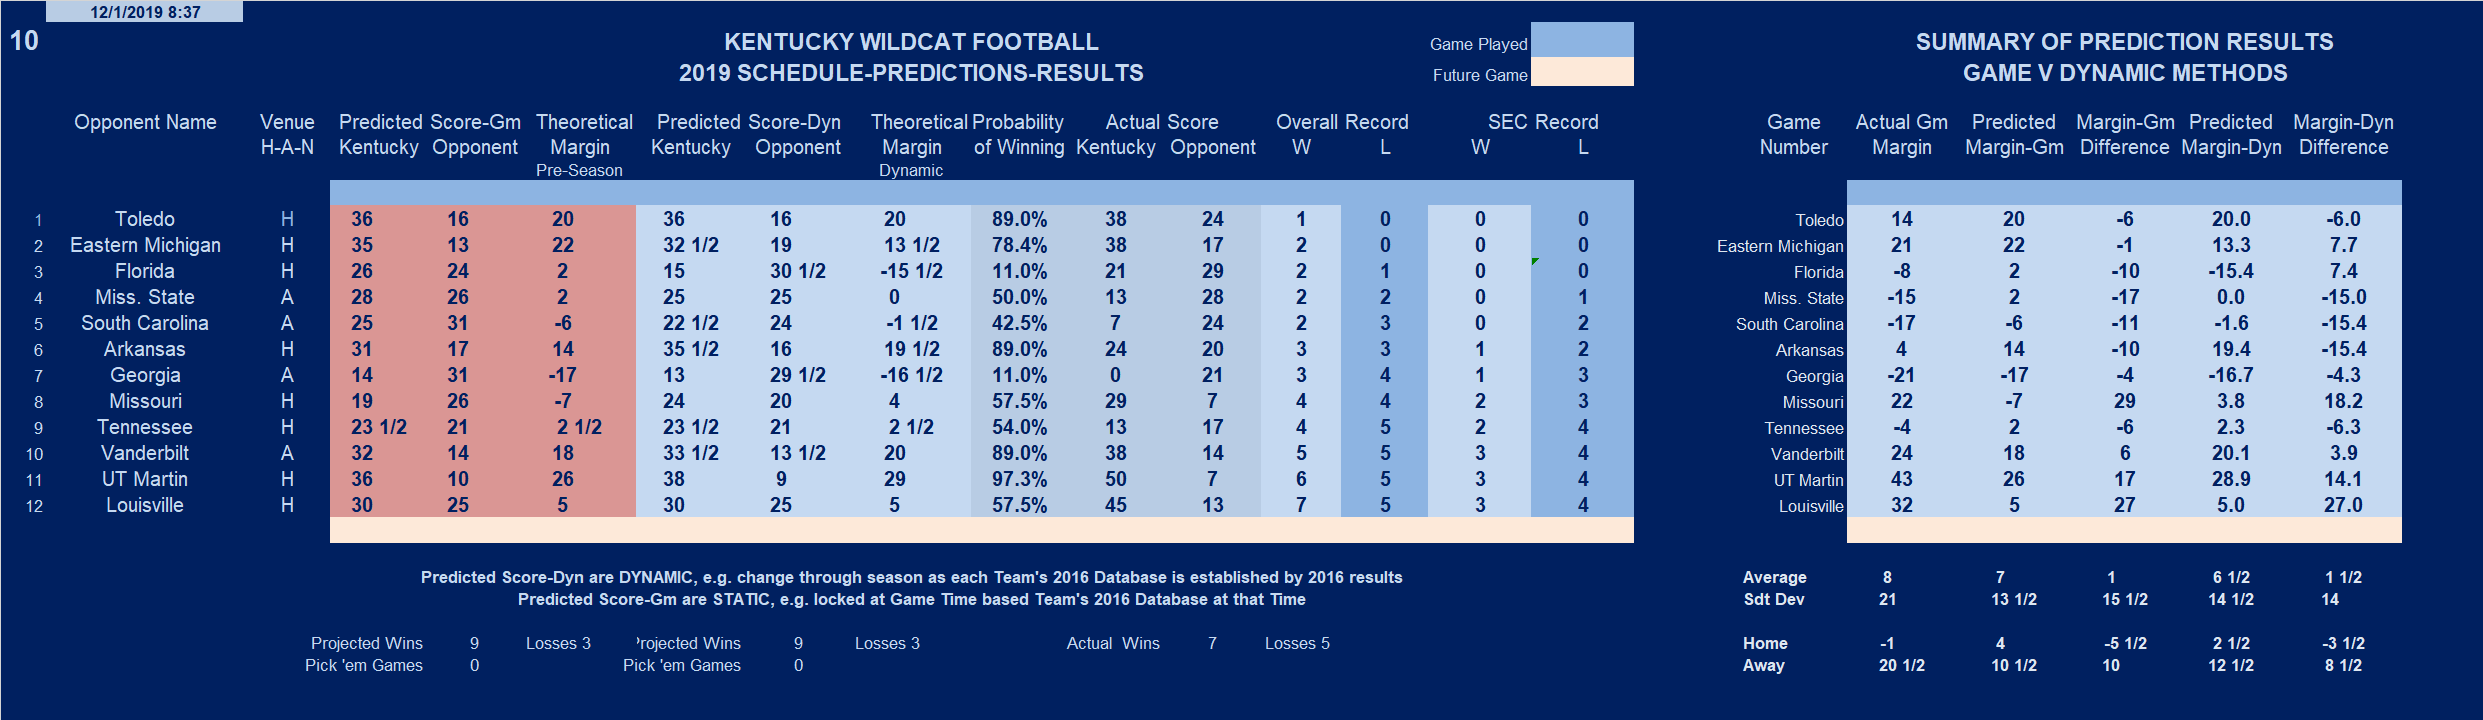
Pre-Season
Comparison of Actual Yards Given and Allowed
VS Average Yards Gained and Allowed
By Opponent
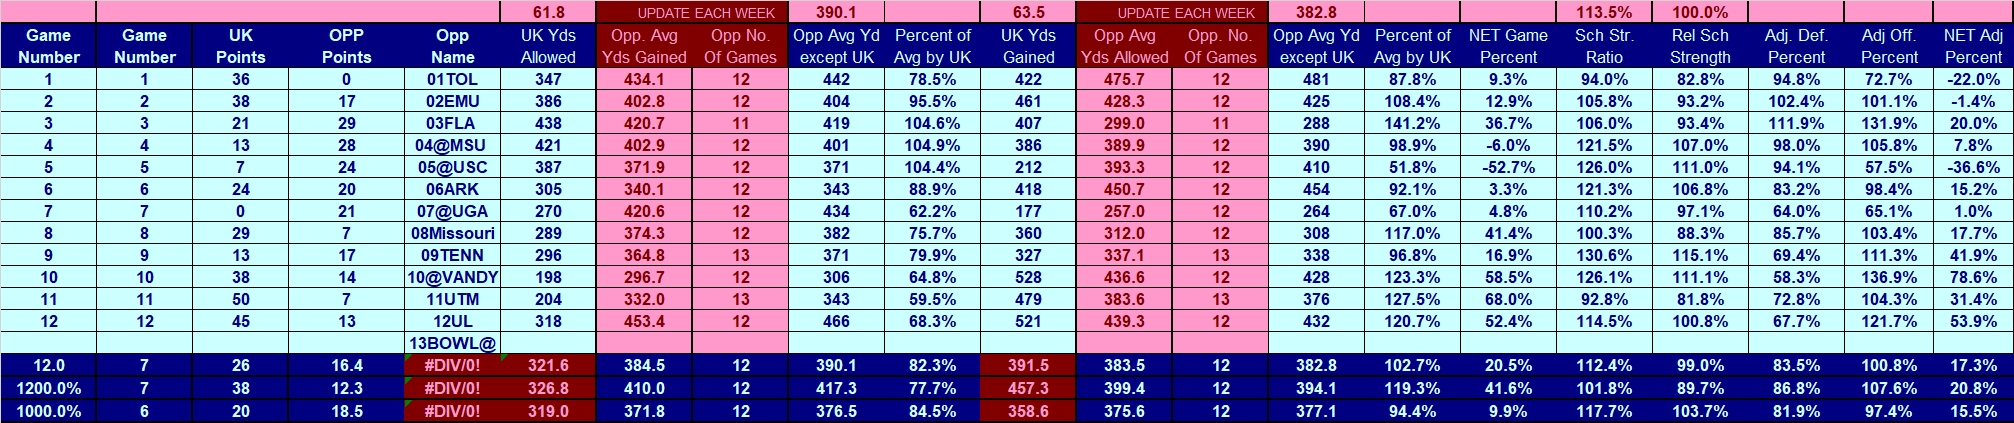
See How the Above Information Tracks Through the Entire Season Using This LINK
SEC SEASON RESULTS WITH ANE AND VEGAS LINES
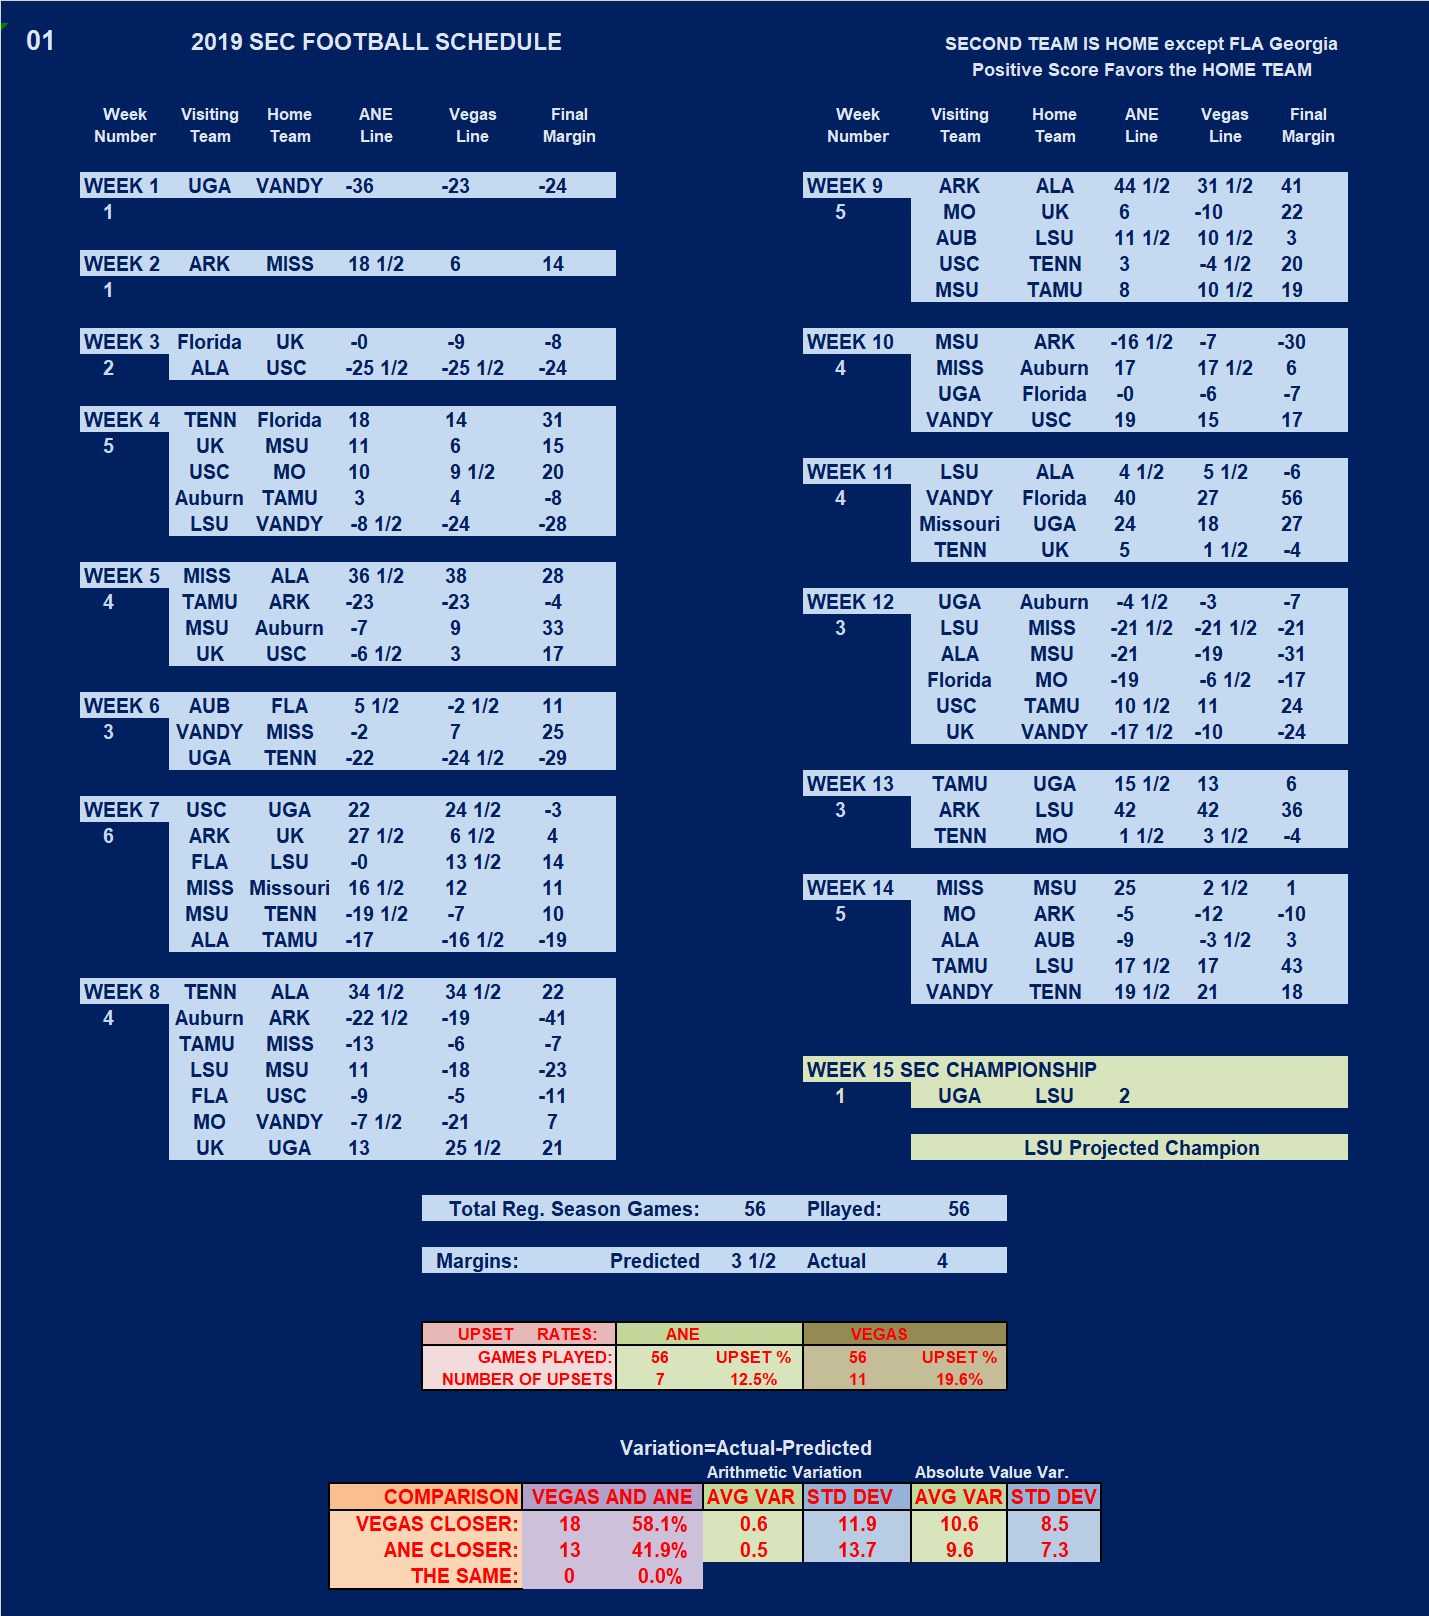
2019 SEC Schedule
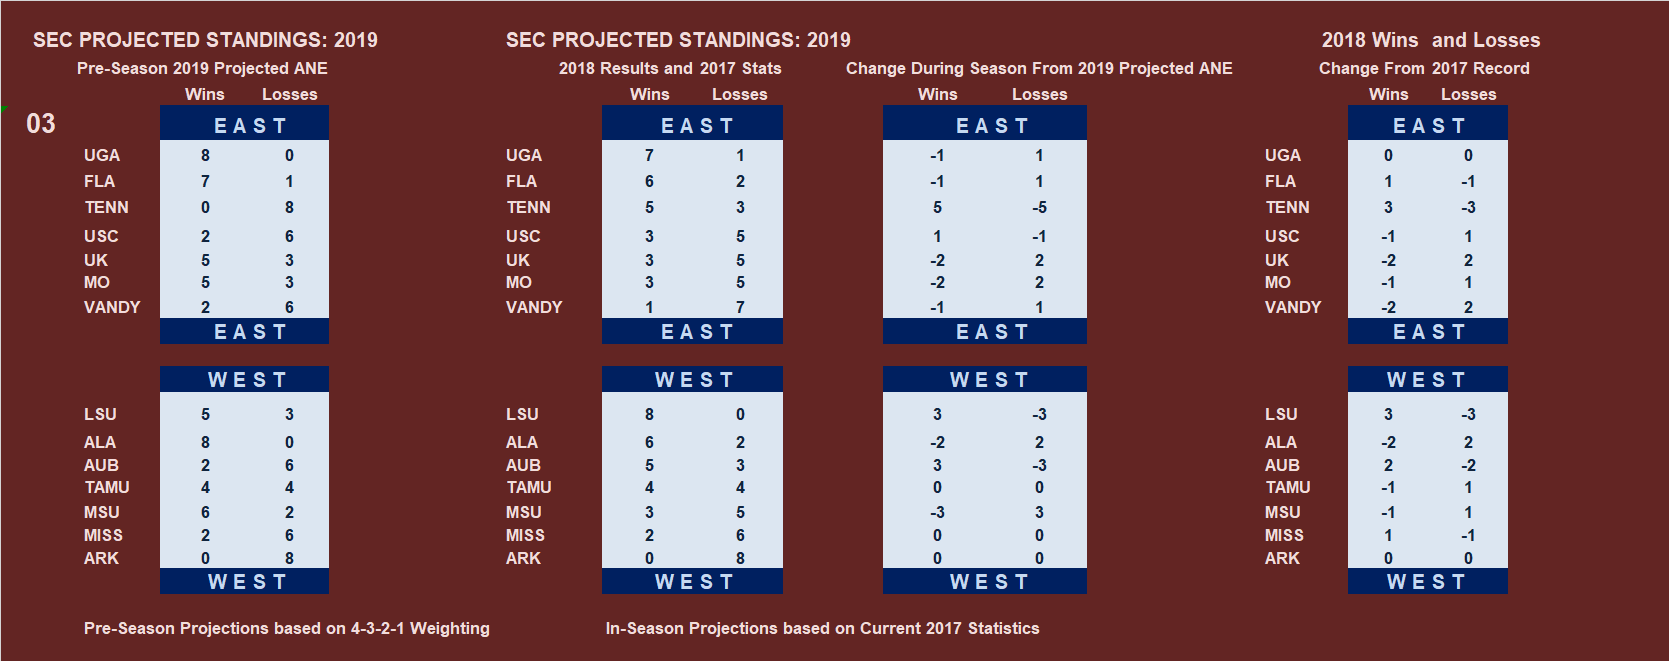
SEC PROJECTED FINAL STANDINGS
BASED ON RESULTS TO DATE AND ANE PROJECTIONS
SEC GAME RESULTS AND
PROJECTED OUTCOMES MATRIX
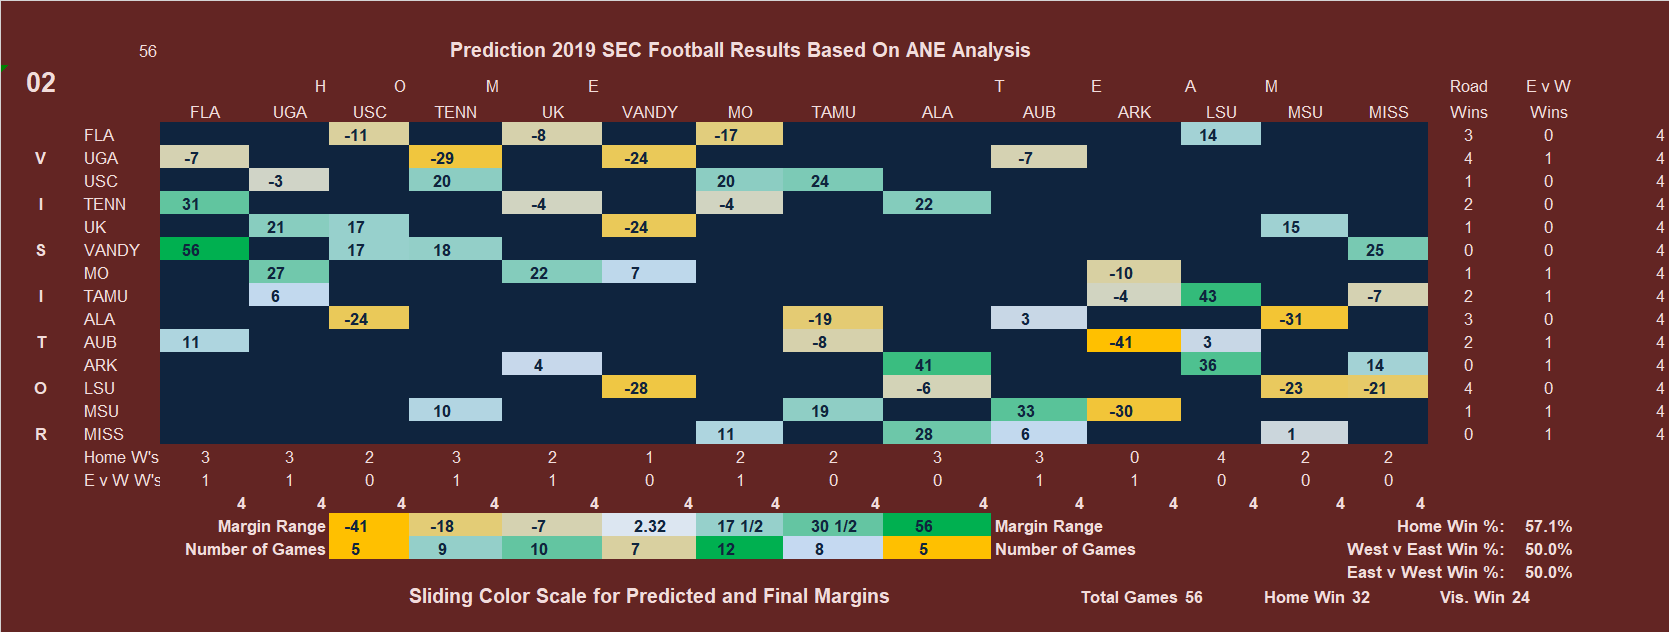
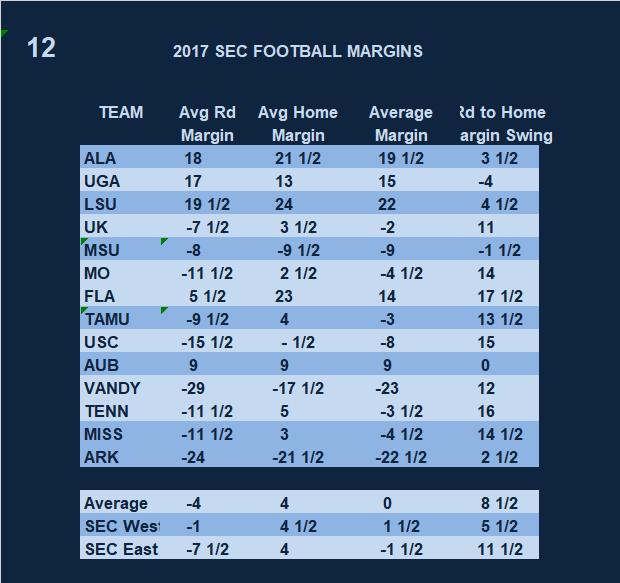
SEC SCORINGS MARGINS
ROAD-HOME-OVERALL AVERAGES
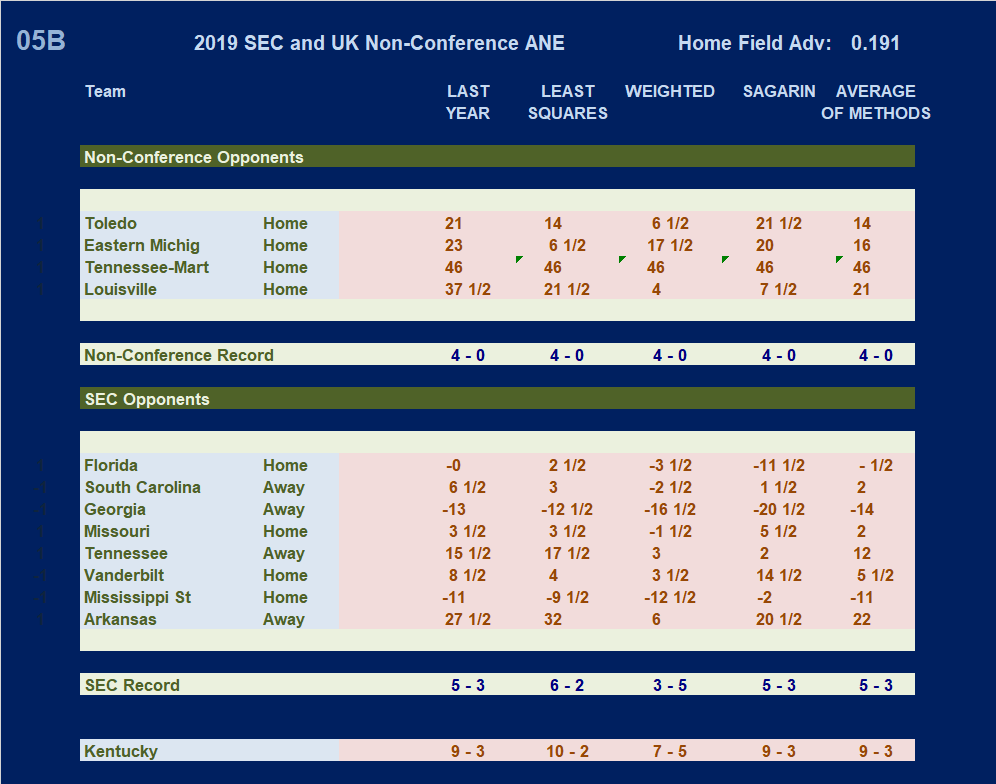
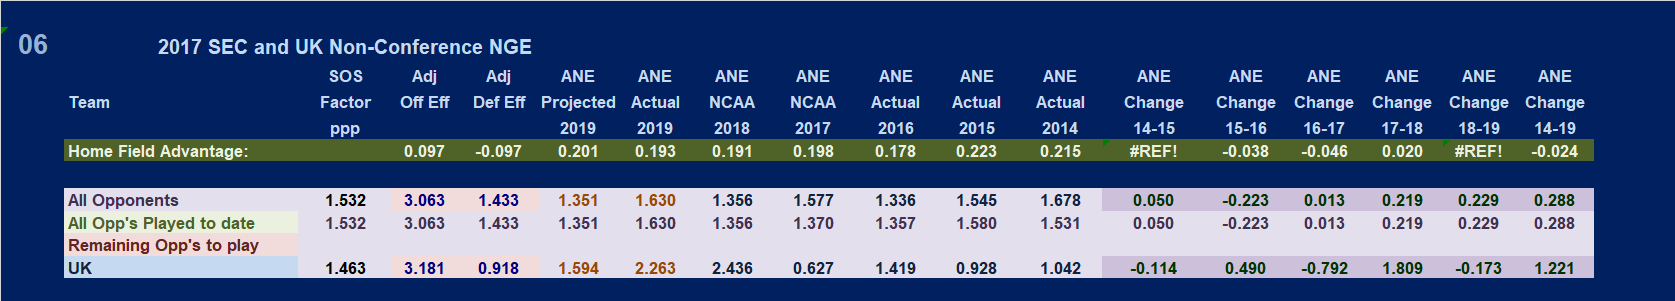
SAGARIN RATINGS FOR SEC AND
UK NON-CONFERENCE OPPONENTS
See How the Sagarin Ratings Tracks Through the Entire Season Using This LINK
Current Data For All SEC and UK Opponents
Click For Larger View of Table
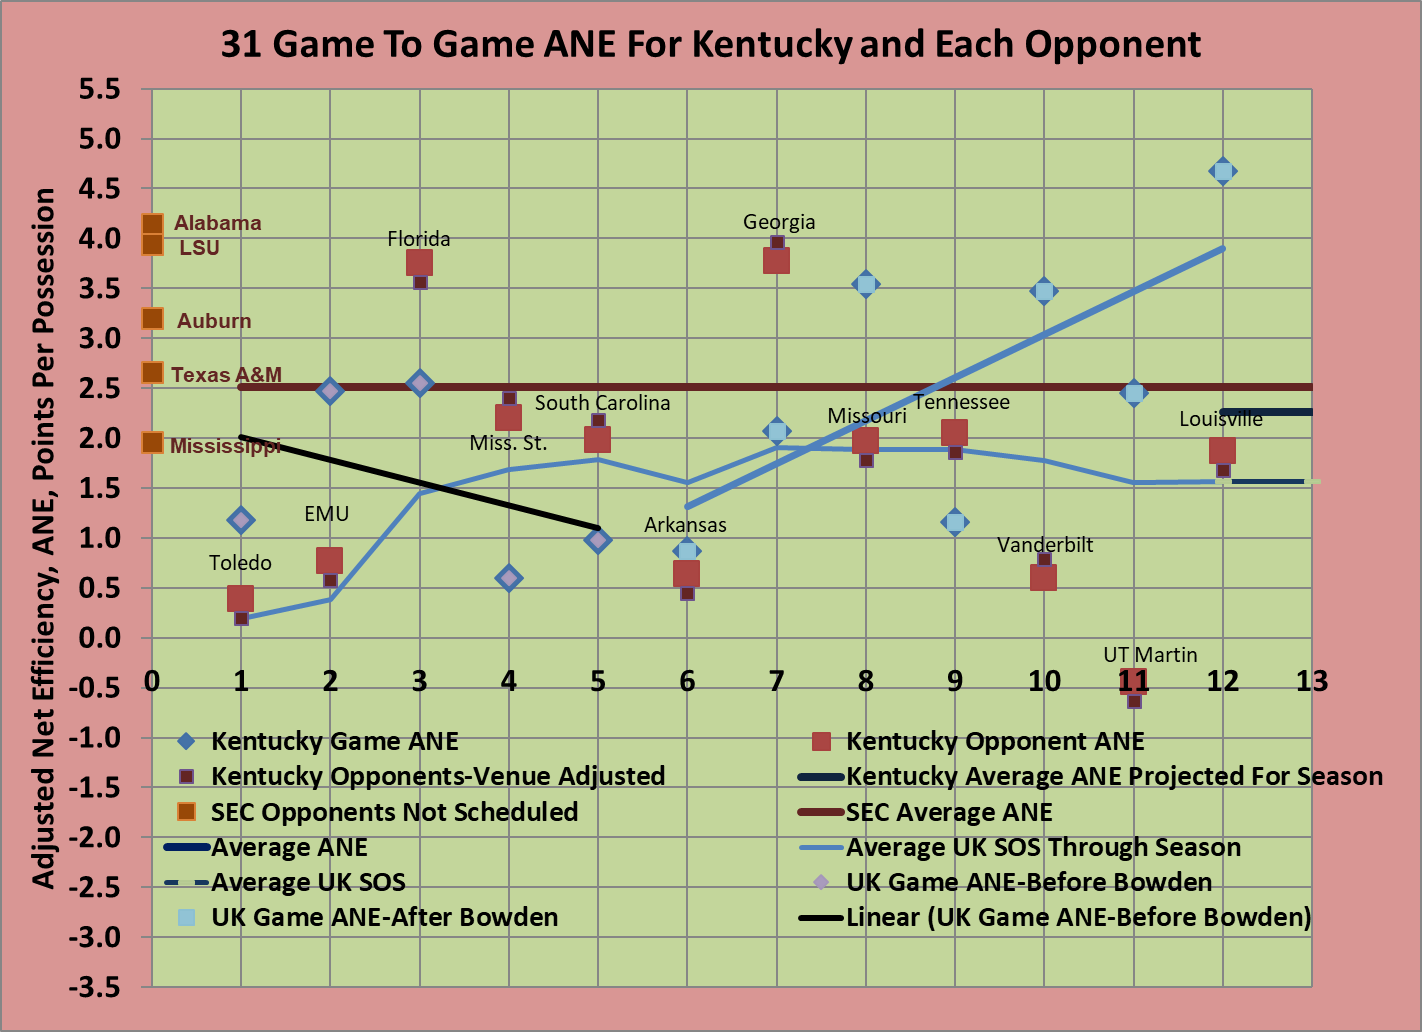
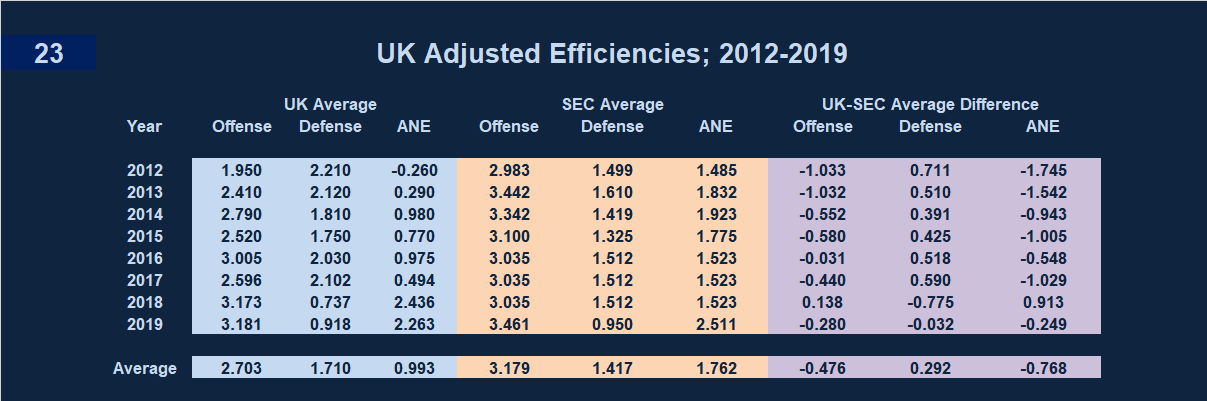
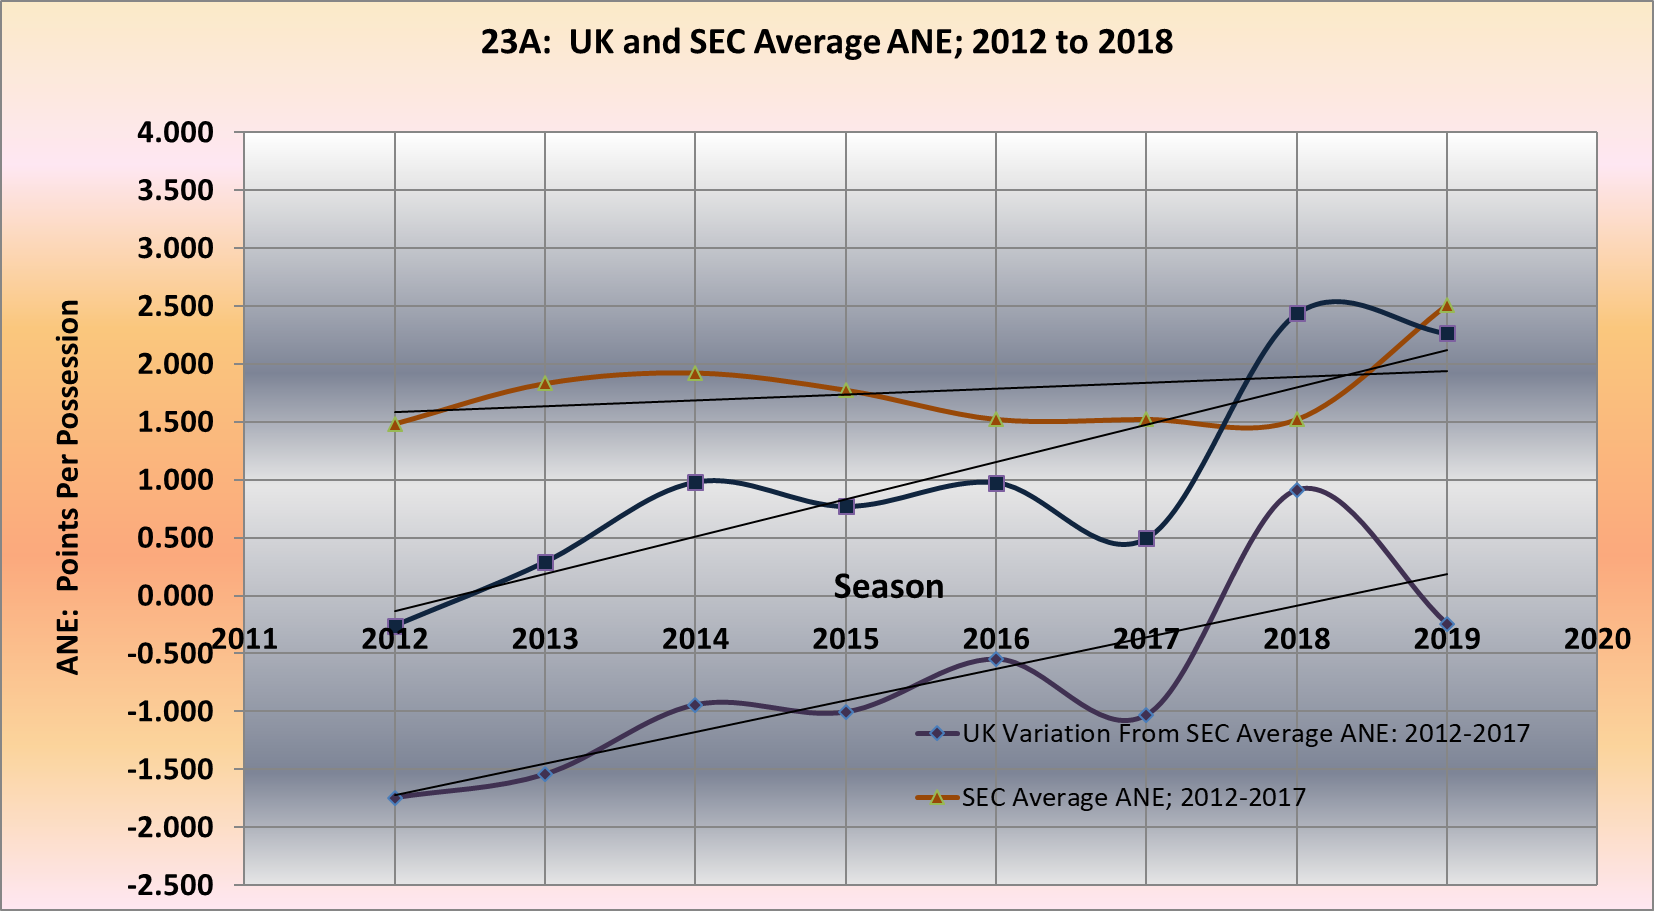
ANE TRACKING BY SEASON FOR SEC AND
UK NON-CONFERENCE OPPONENTS
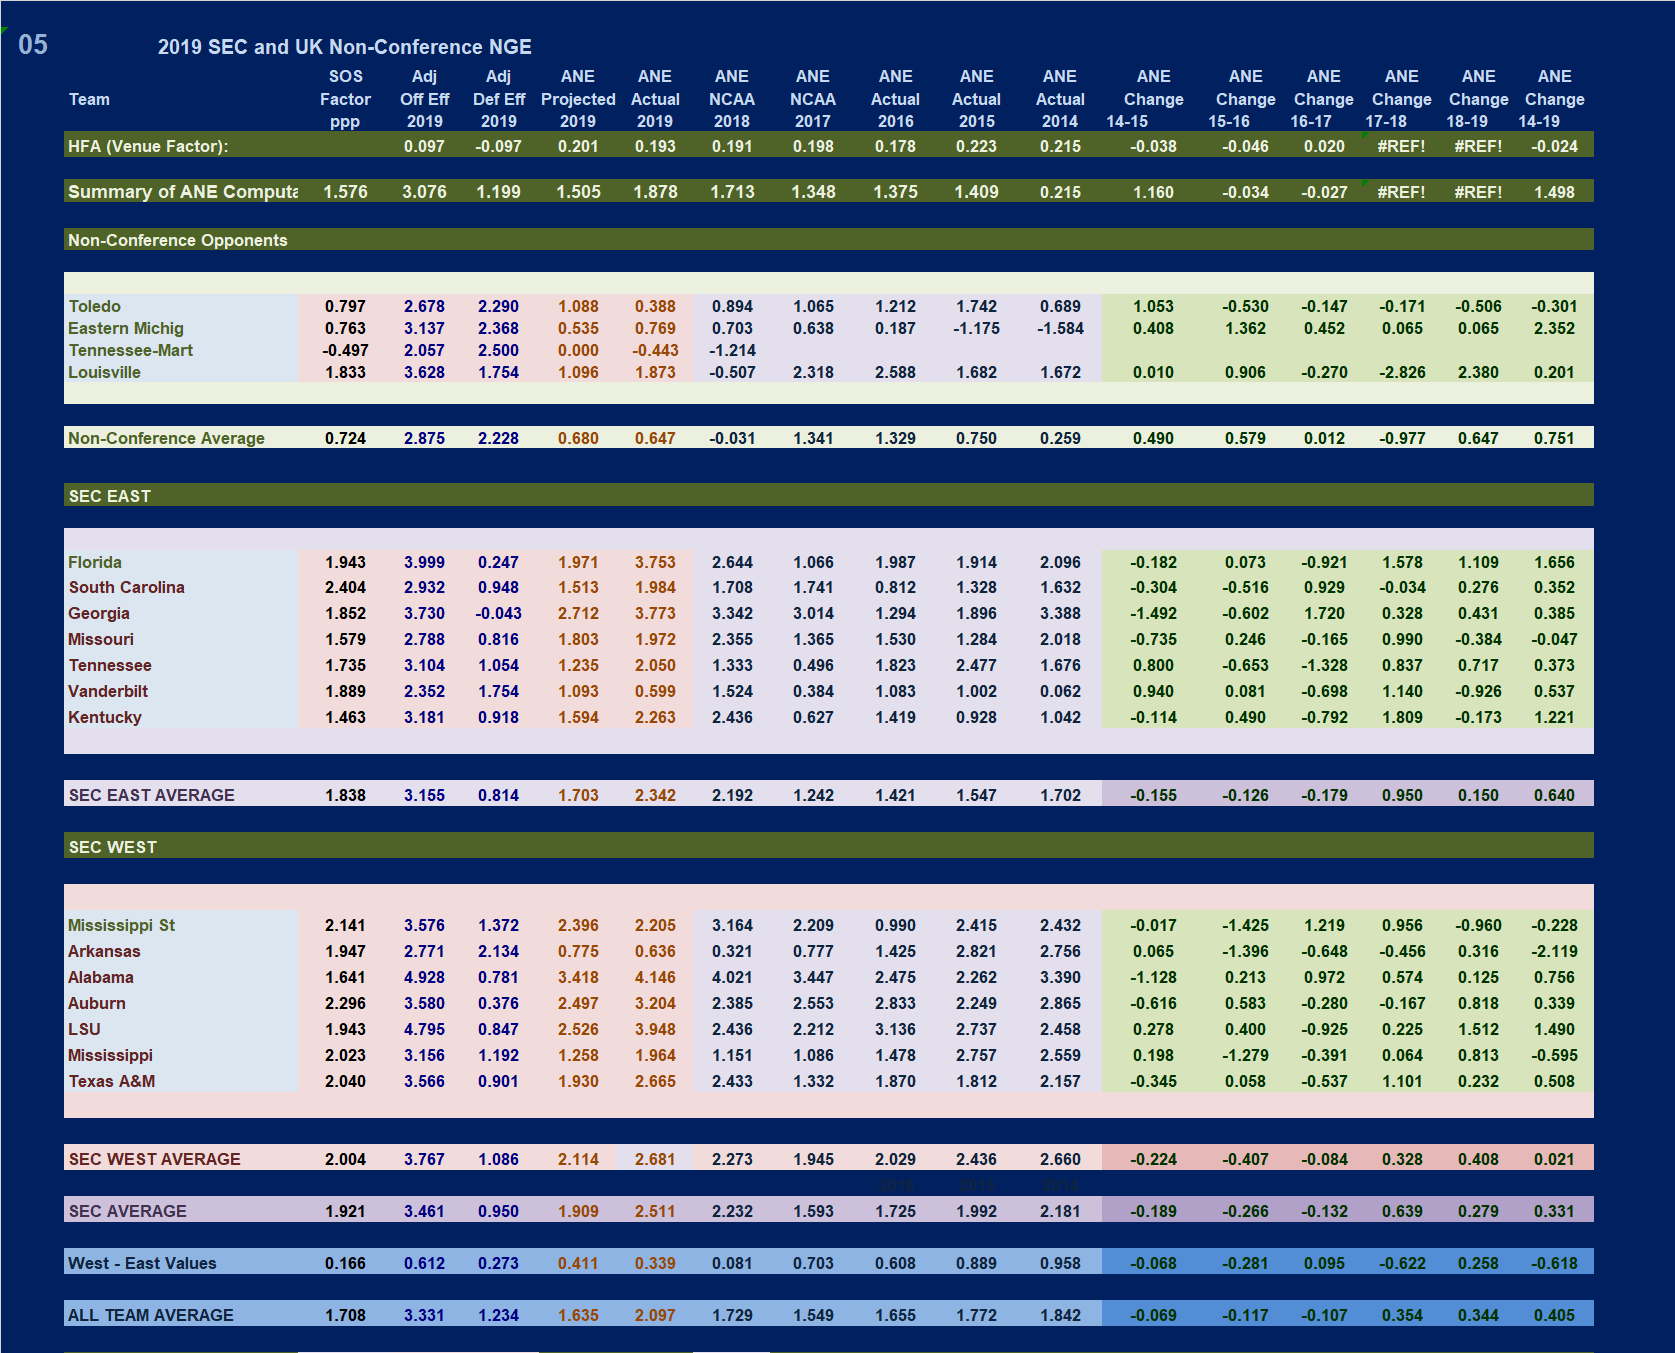
ANE TRACKING FOR
UK OPPONENTS
PLAYED AND TO BE PLAYED
See How the ANE Ratings Track Through the Entire Season
Using This LINK
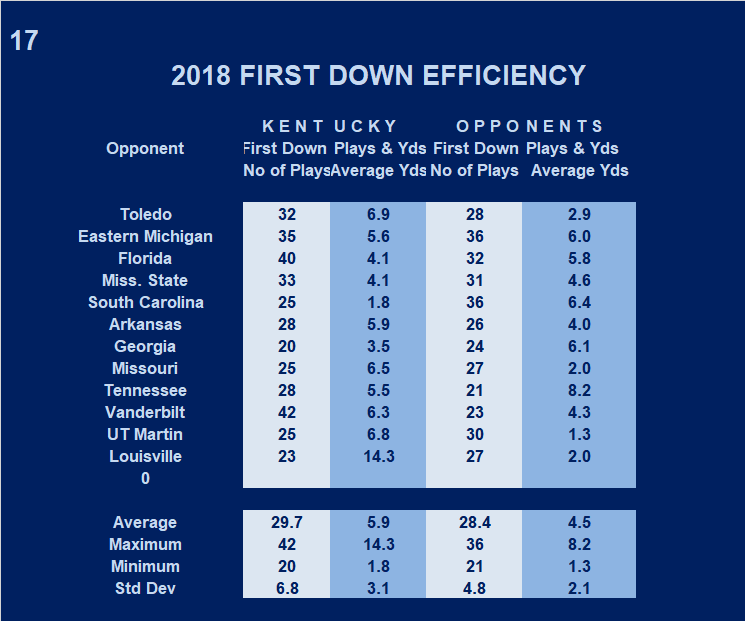
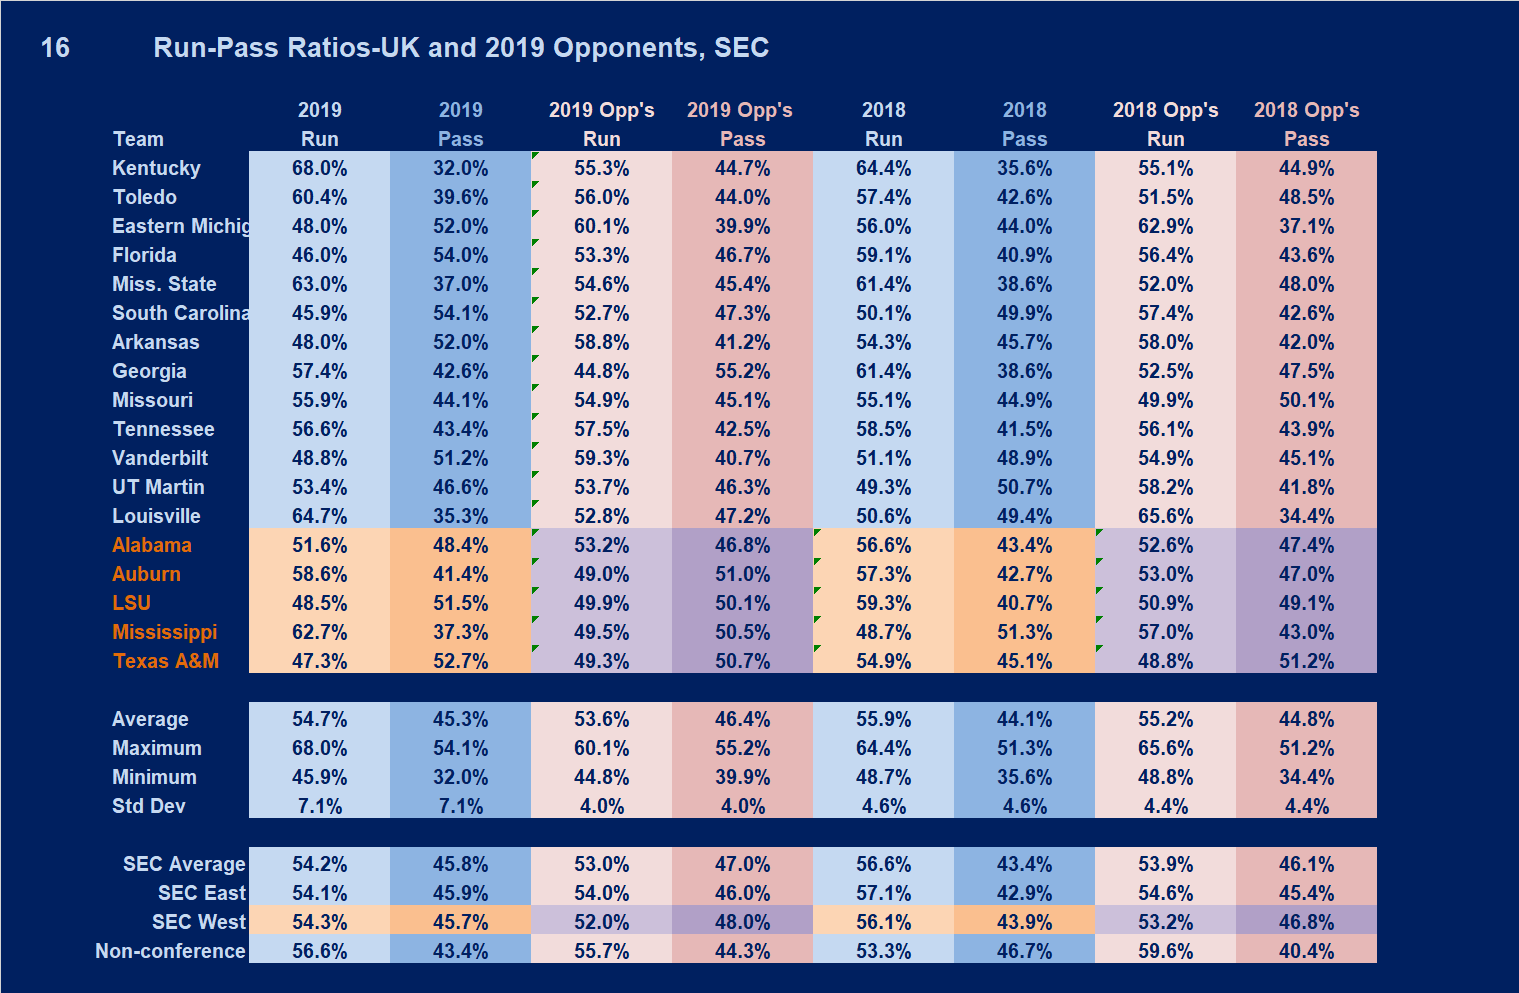
2018 FIRST DOWN EFFICIENCY
PASS AND RUN PLAY RATIO FOR UK AND 2018 UK OPPONENTS
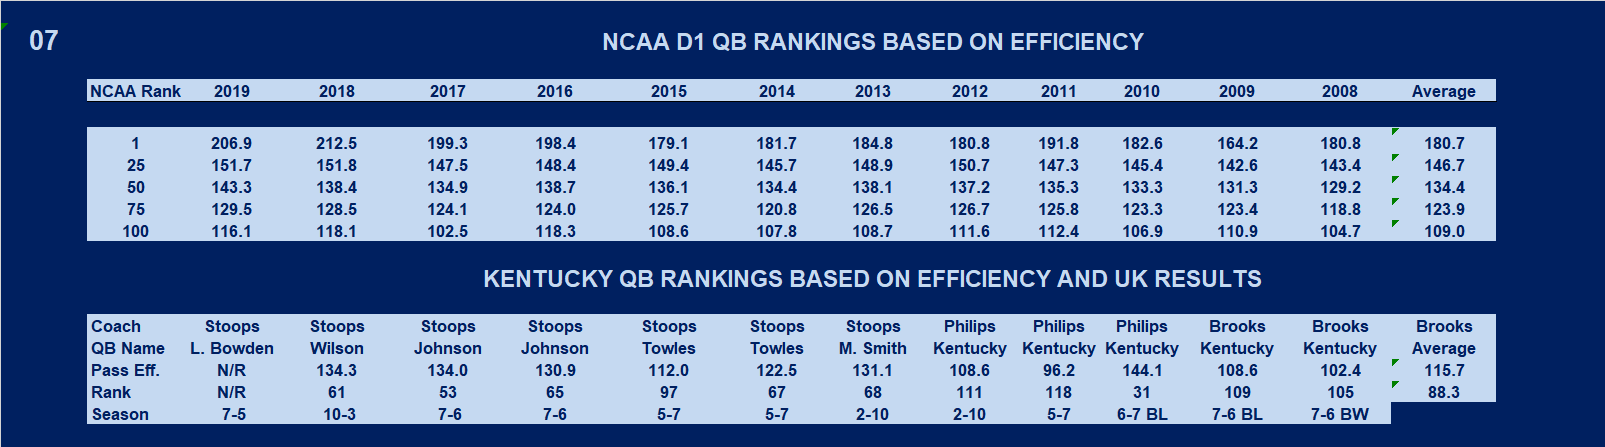
NCAA D1 QB PASSING EFFICIENCY
2008 THROUGH 2017
Click Image For Larger View of Table
NCAA D1 THIRD DOWN CONVERSION RATES
Offense and Defense
2007 THROUGH 2018
Click Image For Larger View of Table
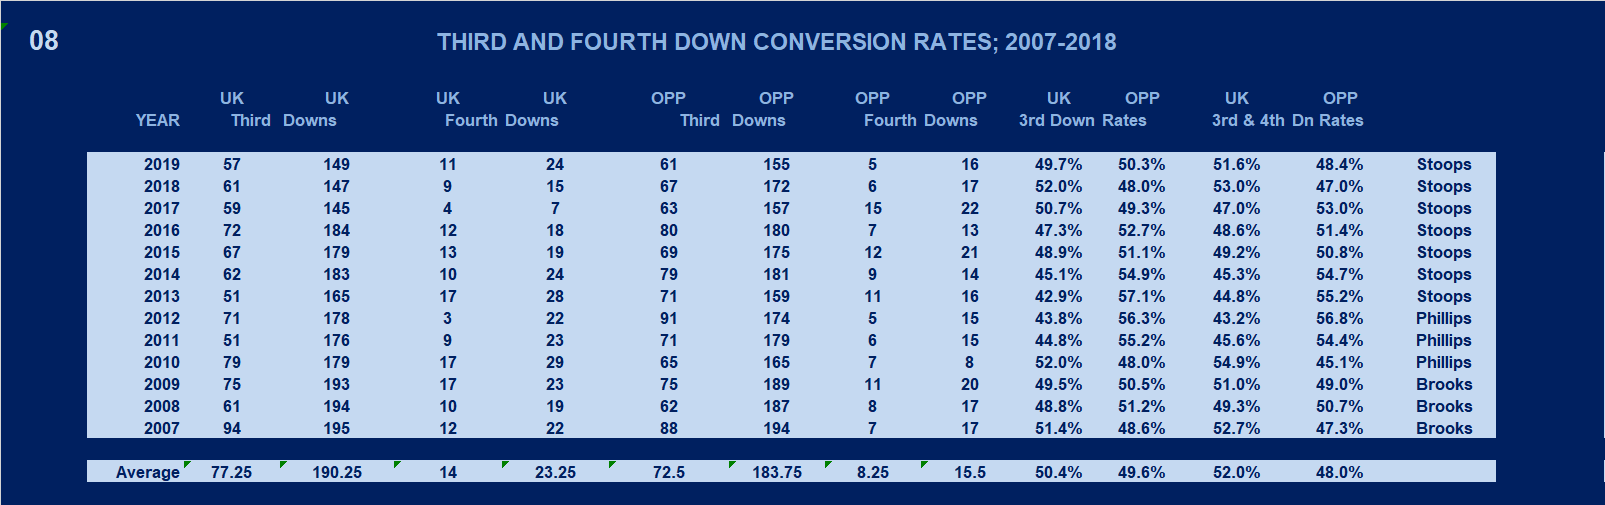
UK THIRD AND FOURTH DOWN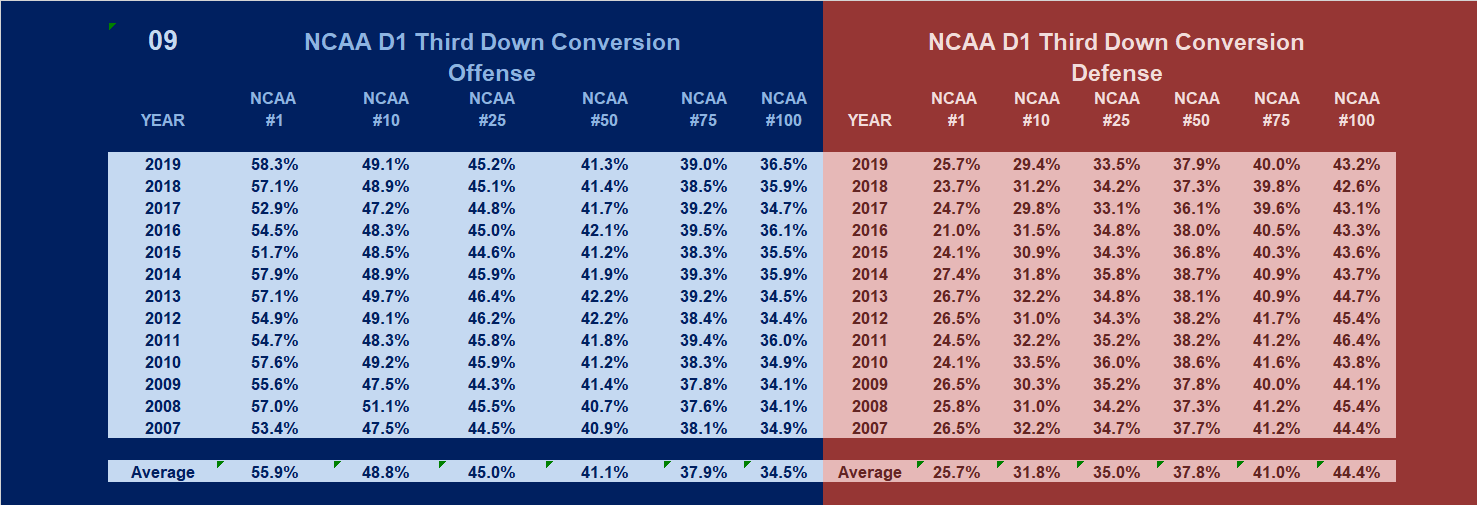 CONVERSION RATES
2007 THROUGH 2018
Click Image For Larger View of Table
Submitted by Richard Cheeks
Copyright 2019
SugarHill Communications of Kentucky
All Rights Reserved