BIG BLUE FANS FOR
![]()
BASKETBALL
![]()
To the 2010-11 Offensive Rebounding Efficiency

ACTUAL FINAL GAME STATISTICS
AND EFFICIENCY ANALYSES
A New Feature for the "Last Game" page introduced during the 2008-09 season.
The following charts provide an overview of the season long performance of this team.
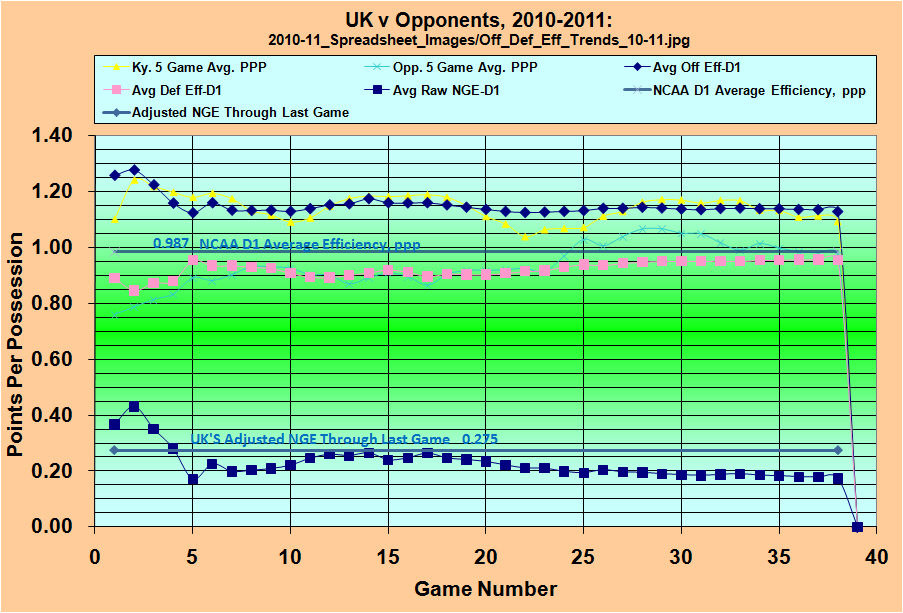
Offensive and Defensive Efficiency Trends
Adjusted NGE Trends
By Game Number
![]()
To the 2010-11 Offensive Rebounding Efficiency
- All Games
- All Games-D1 [No Exhibitions]
- Home
- Away
- Neutral Court
- Non-Conference
- SEC
- RPI Top 50
- RPI Over 50
- Post Season Play
- Games Since Louisville Game
- SEC Tournament
1. Pace values will be lower, by the number of offensive rebounds.
2. Efficiencies will be higher due to the lower number of total possessions
3. Turnover rates will be higher due to the lower number of possessions.
CHECK OUT THESE OTHER ANALYTICAL WRITINGS
Change in Position on Definition of Possessions
Do Objective Performance Measures Like NGE
Account For Intangible?
Copyright 2006 - 2009
SugarHill Communications of Kentucky
All Rights Reserved