BIG BLUE FANS FOR
![]()
BASKETBALL
![]()
To the Prediction for UK's NEXT GAME
ANALYSIS OF THE KENTUCKY'S
GAME PERFORMANCES
OFFENSIVE REBOUNDING EFFICIENCY
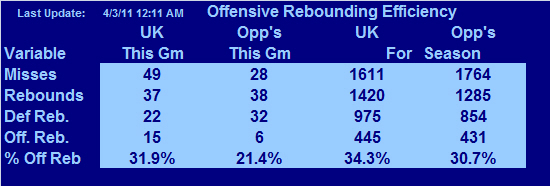
The Percentage of Offensive Rebounds is
the number of Offensive Rebounds
divided by the total number of reboundable misses.
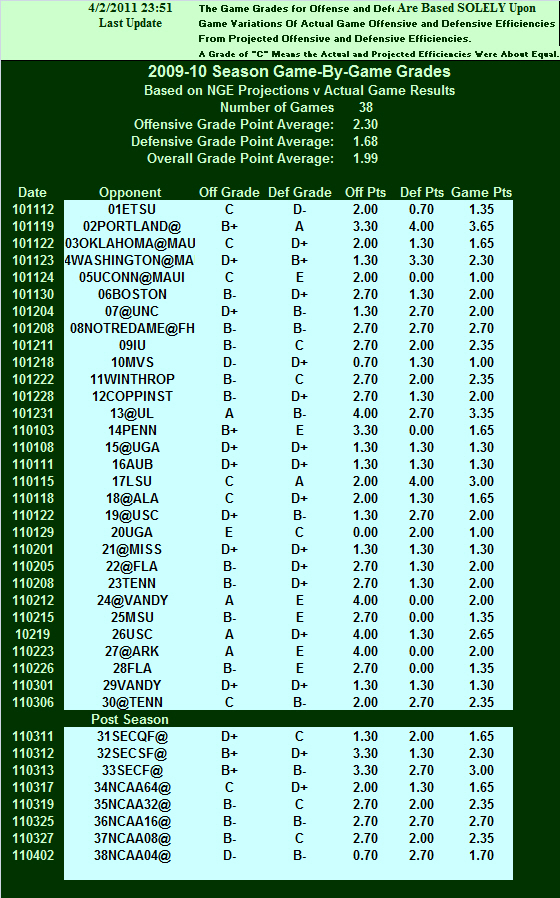
The Game Grades for Offense and Defense
Are Based SOLELY Upon
Game Variations Of Actual Game Offensive and Defensive Efficiencies
From
Projected Offensive and Defensive Efficiencies.
A Grade of "C" Means the Actual and Projected Efficiencies Were About Equal.
If A Team Is Playing Very Well Overall,
Then "C" means That Team Again Played Very Well.
If A Team Is Playing Very Poorly Overall,
Then "C" means That Team Again Played Very Poorly.
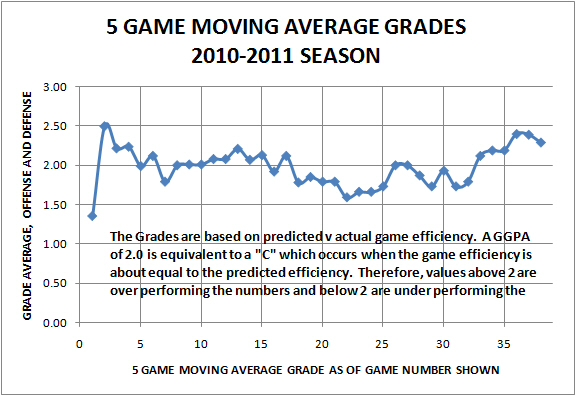
5-GAME RUNNING AVERAGE GRADES
"C" = 2.0
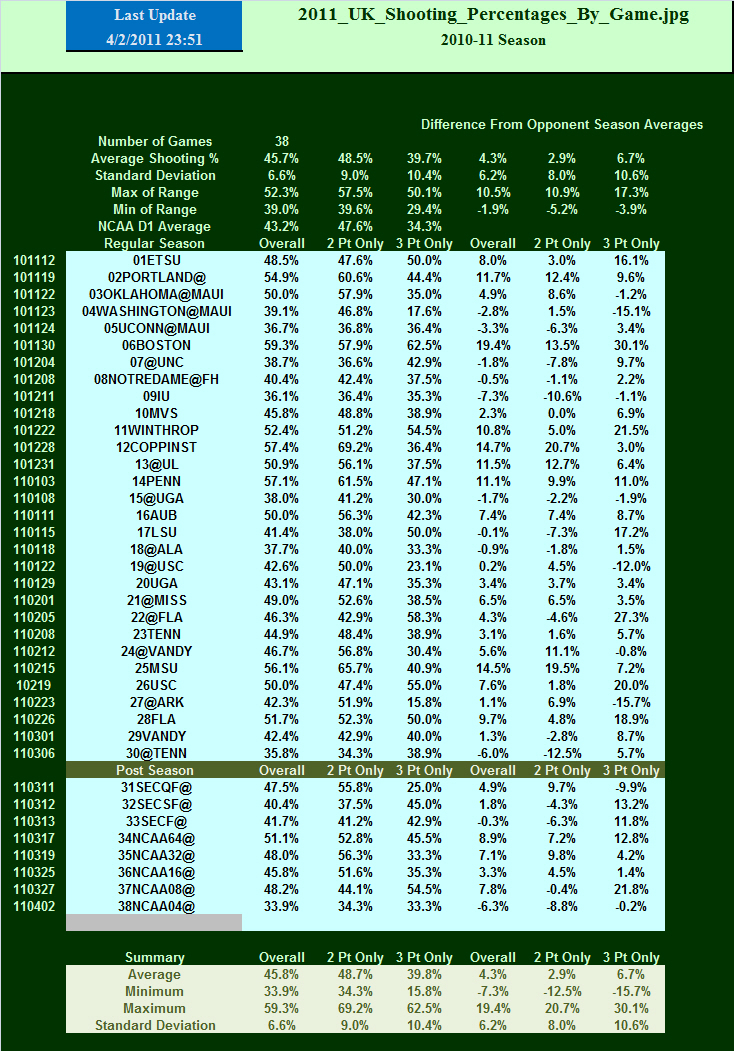
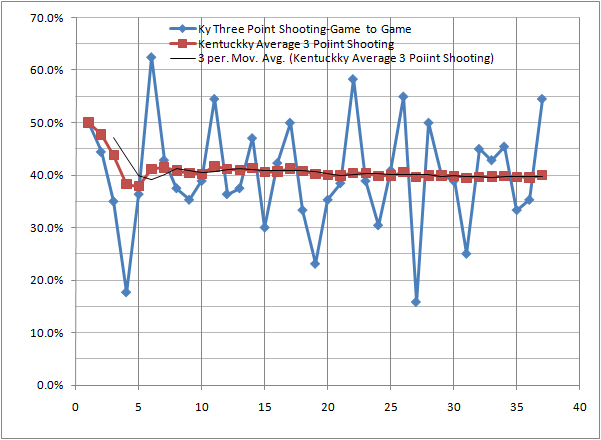
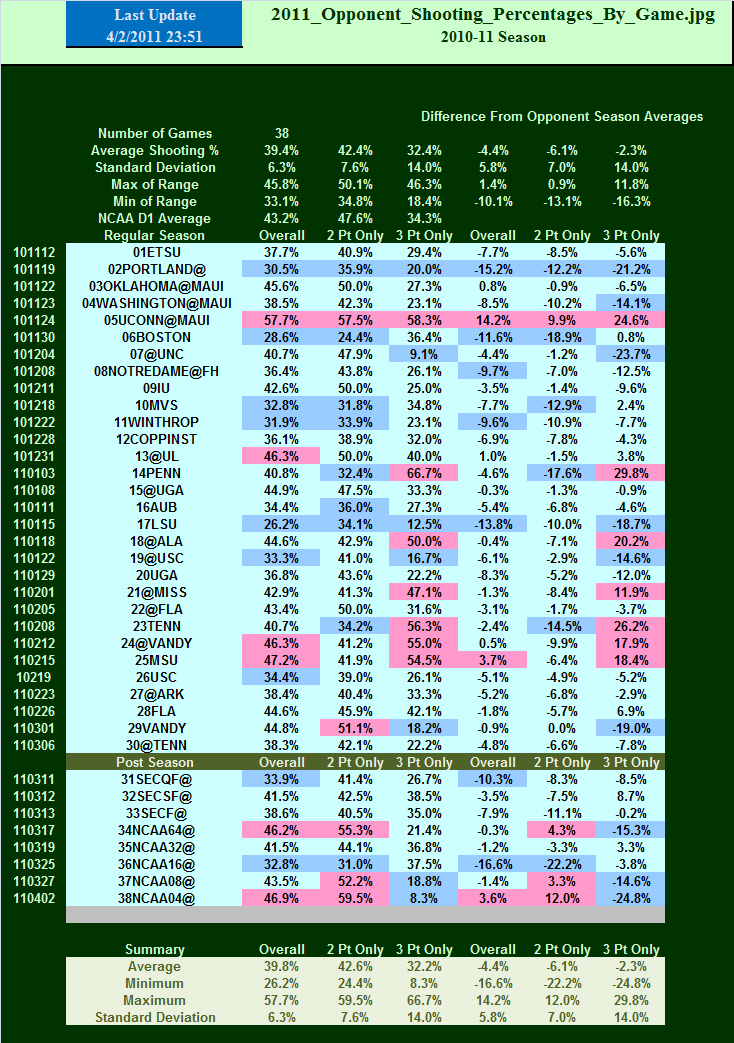
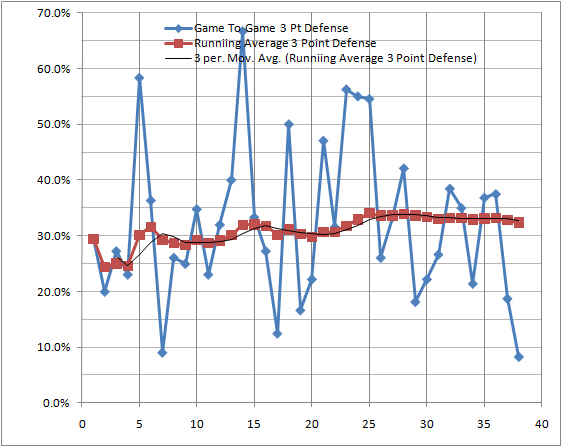
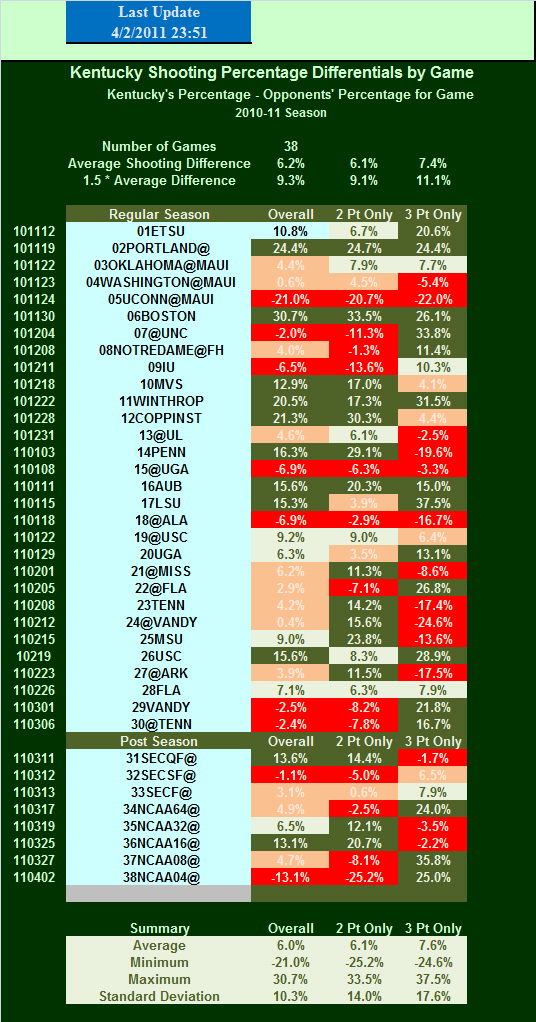
Shooting Percentages Should Be Self-Explanatory
Columns are: Date, Opponent, Total Shooting, and 3-Point Shooting
Comparisons To NCAA D1 Averages, and Consistency Also Addressed
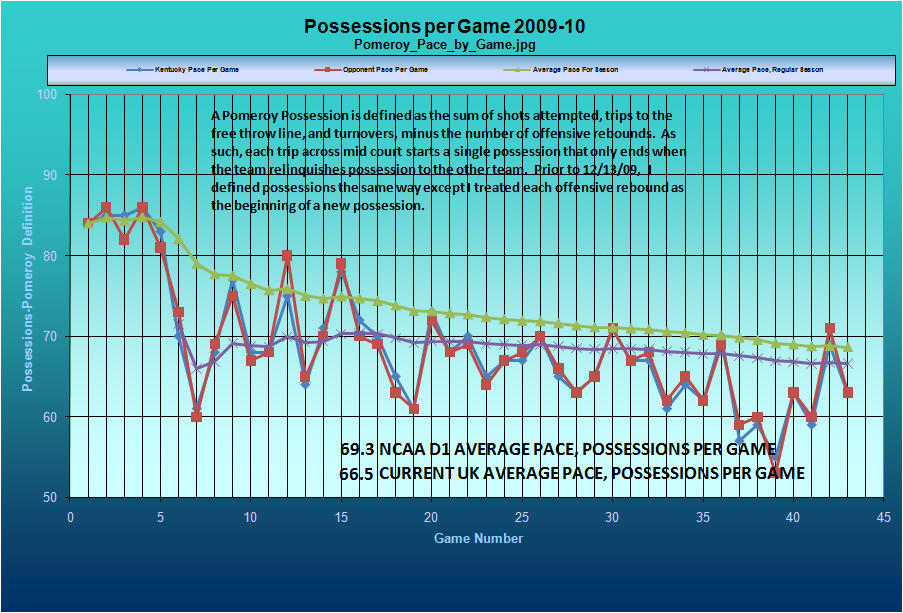
Pace Should Be Self-Explanatory
A Possession Occurs when a team makes a basket,
makes free throws ending their possession, or makes a turnover.
If a team misses a shot, and loses possession, it is a possession for that team,
but if a team misses a shot and retains possession,
it is not a complete possession until one of the previously identified
events occur to end the possession
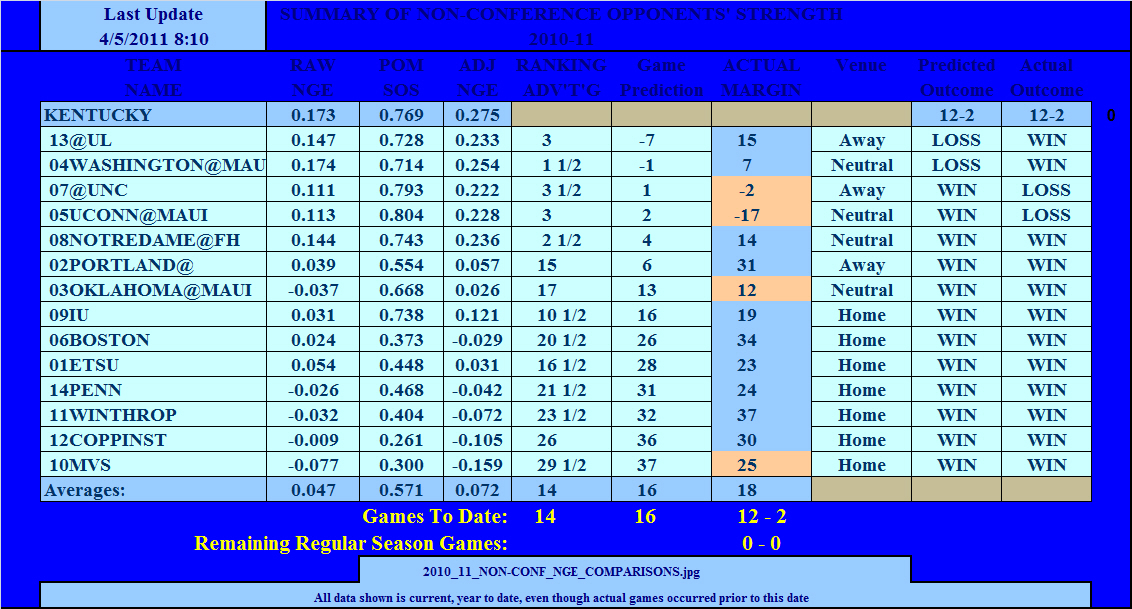
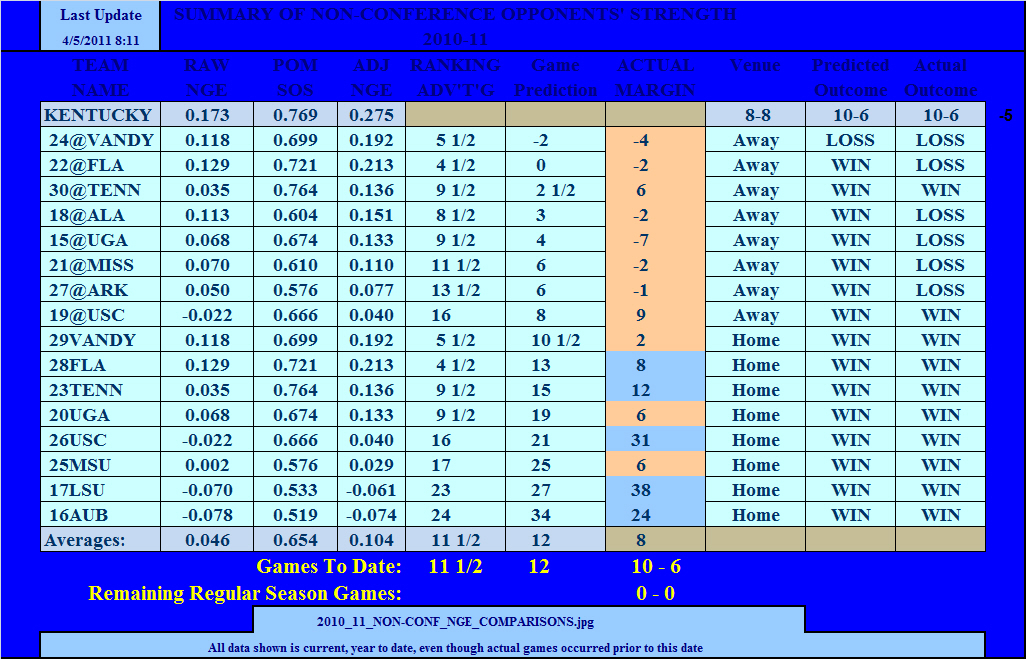
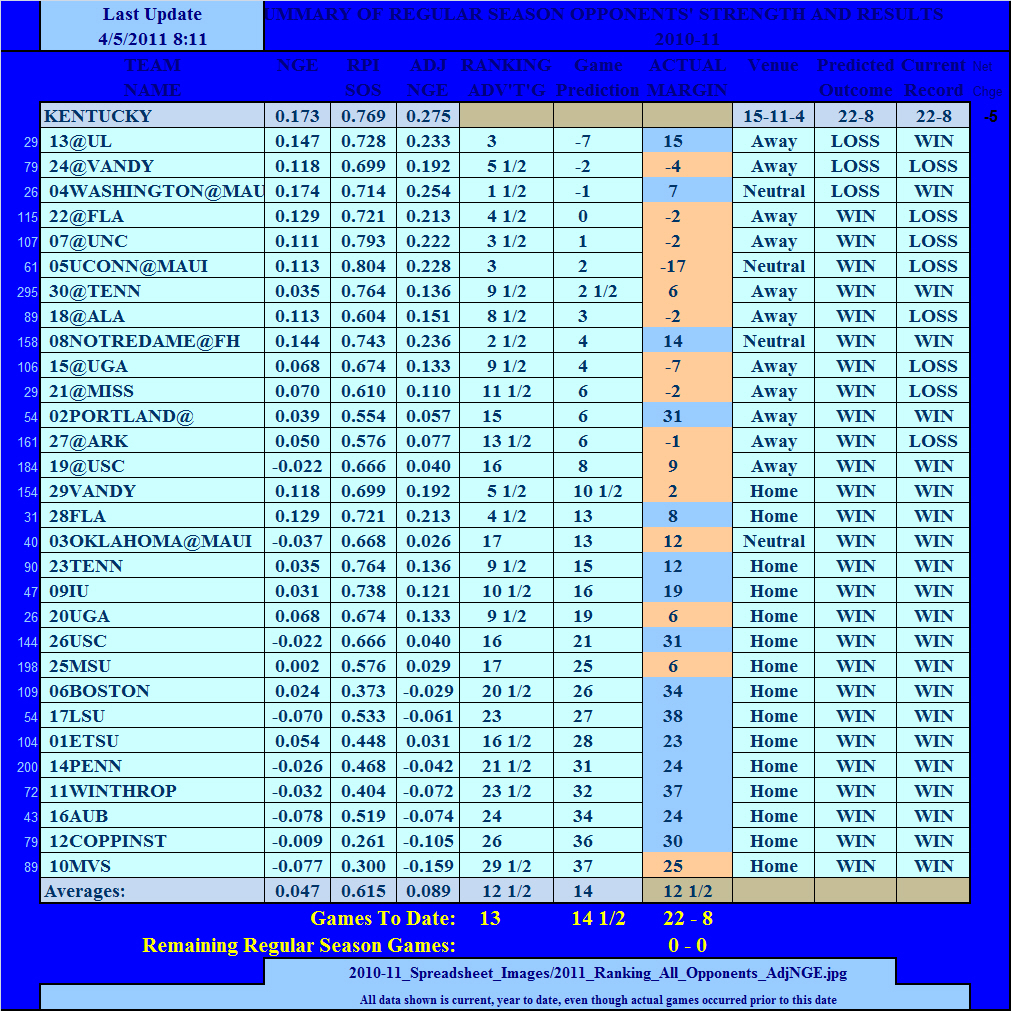
The Above Tables Provide A Current Ranking of All UK Opponents
Based On the Current Adjusted NGE.
The Current Predicted Margin For That Game Is Based on
Venue and Current Adjusted NGE Ranking.
This is a very dynamic analysis and varies throughout the season
as teams play additional games, as their raw NGE fluccuates, and
as their schedule strength varies.
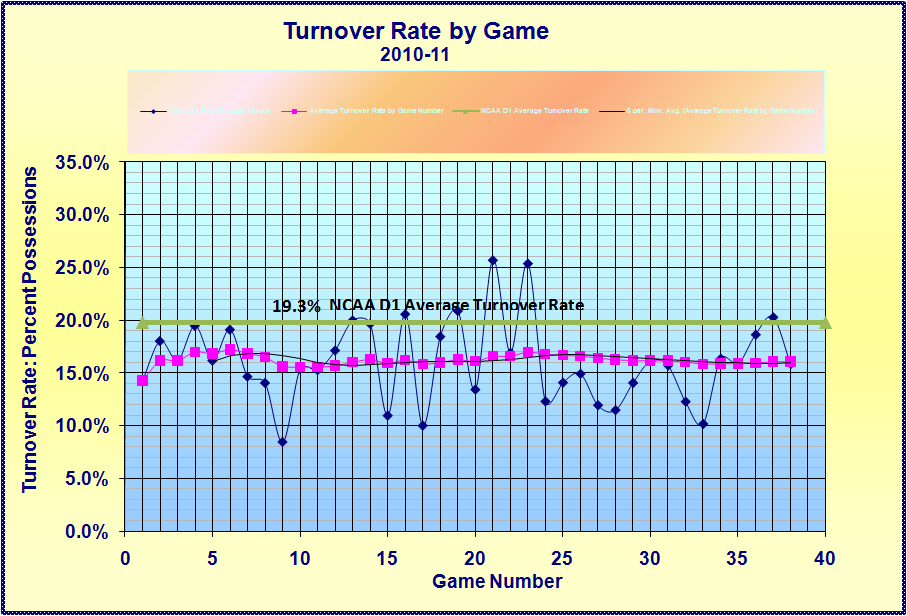
Turnover Rates, Percentage of Total Possessions Ending with Turnovers
Game by Game, and Season Averages Presented
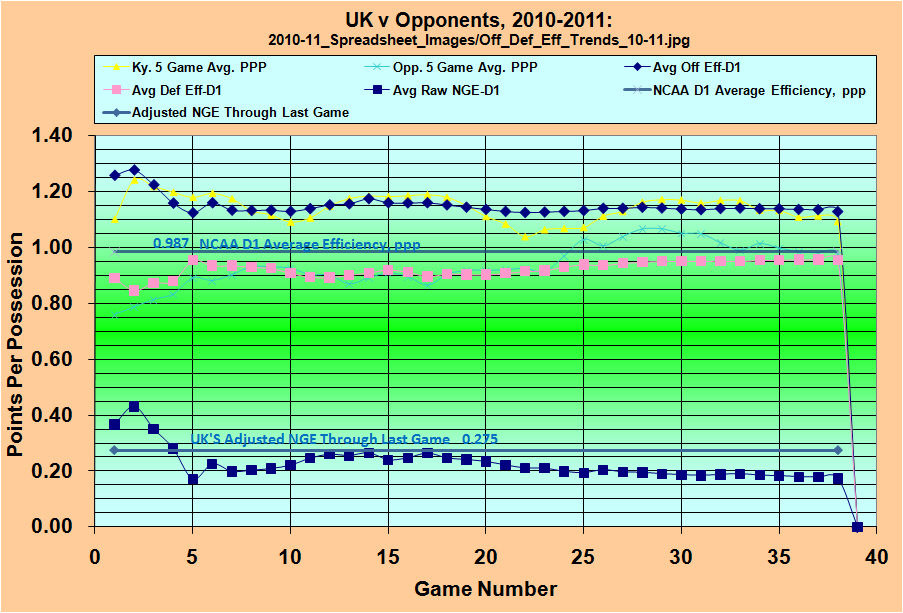
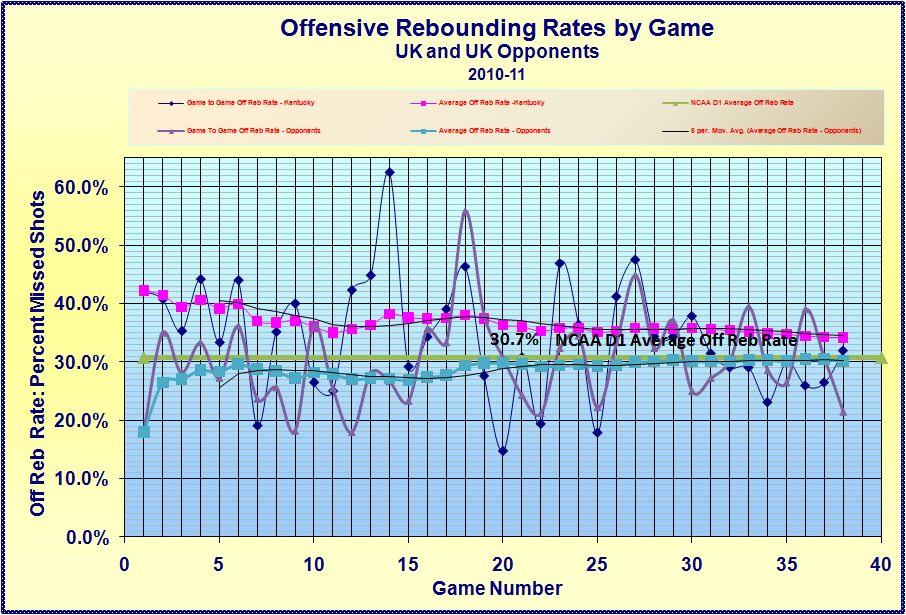
Offensive and Defensive Efficiency Trends
Track Game by Game Throughout Season
ALL TABLES AND GRAPHS ARE UPDATED FOLLOWING EACH GAME DURING THE SEASON
![]()
To the Prediction for UK's NEXT GAME
- All Games
- All Games-D1 [No Exhibitions]
- Home
- Away
- Neutral Court
- Non-Conference
- SEC
- RPI Top 50
- RPI Over 50
- Post Season Play
- Games Since Louisville Game
- SEC Tournament
1. Pace values will be lower, by the number of offensive rebounds.
2. Efficiencies will be higher due to the lower number of total possessions
3. Turnover rates will be higher due to the lower number of possessions.
CHECK OUT THESE OTHER ANALYTICAL WRITINGS
Change in Position on Definition of Possessions
Do Objective Performance Measures Like NGE
Account For Intangible?
Copyright 2006 - 2010
SugarHill Communications of Kentucky
All Rights Reserved