BIG BLUE FANS FOR
![]()
BASKETBALL
2010-11 Season Analytical Writings
16A
HOW DID THE 2010 UK TEAM IMPROVE DURING THE SEASON
AND HOW IS THE 2011 TEAM DOING IN COMPARISON?
It is Christmas, and there are no games. The players have gone home for the Holidays, and the Coaches are spending precious time with their families. The news outlets are taking advantage of the silence to do likewisie with family, and this old fan is left to his own resources. This morning, a fan posed an interesting question at the Vaught's Views blog regarding how UK teams tend to improve over the course of a season. Of course each team is unique with respect to the level of its play, and whether the trends of those levels show improvement over the course of the season. The 2009-10 and 2010-11 teams provide interesting cases for this question.
The following graph shows the Offensive [Dark Blue Diamonds], Defensive [Pink Squares], and Adjusted Net Game [Dark Blue Squares] Efficiencies for the 2009-10 team from start to finish. This Chart is packed full of information, and I have used charts like this to track each UK season for many years. Without getting into the minutia, I want you to look at just a couple of things here.
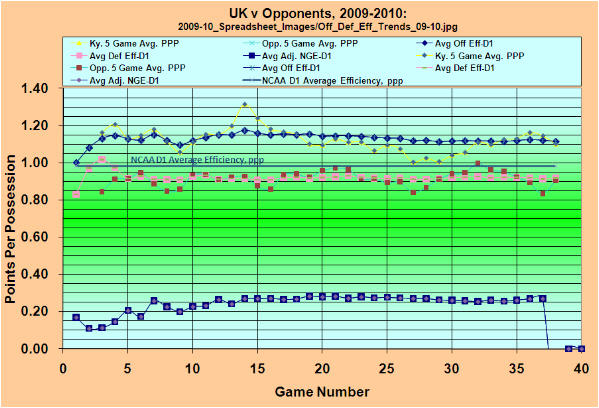
- Note that the data for the first five or so games are very volatile, due to the fact that single game disparities have a significant effect upon the average values; and
- Note that the Adjusted NGE rose steadily [improved] through the first 14 games, and then remained relatively constant over the final 24 games, dipping slightly due to declining offensive efficiency over the last five to ten games of the season.
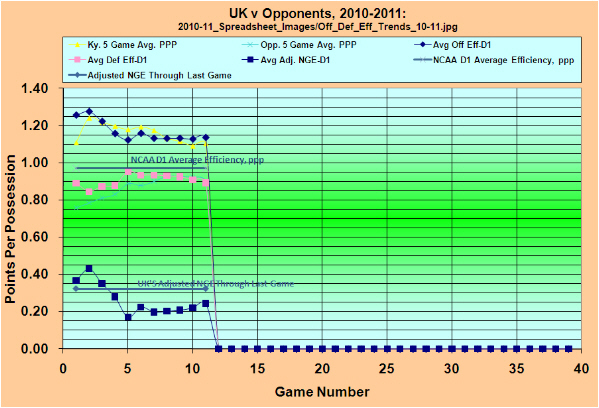
Compare the 2010 charting to the 2010-11 charting for the season through 11 games. Please note that the NGE curve 2011 is Raw NGE, not Adjusted NGE, and I have added a horizontal line to represent the Adjusted NGE through the last game played. Other than that, these charts are the same.
As before, the data is very volatile for the first five or so games. This is a fact that comes from the size of the database, not the volatility or inconsistency of the play during those games. However, since the end of that volatile period, we can see that the Raw NGE has settled down, and is showing some upward [improvement] trend. This trend is primarily coming from improved defense over the last six games as the offensive efficiency has leveled out but the defensive line is showing a visible downward trend.
Comparing 2010 to 2011, I suggest that the following are significant:
- In 2010, the Adjusted NGE never reached 0.30 ppp [the threshold for final four competitiveness] and the 2011 Adjusted NGE is currently about 0.33 ppp;
- In 2010, the offensive efficiency stabilized about 1.15 ppp between games 12 and 23, and then declined and stabilized at it final level, about 1.12 ppp for the last 15 games. Thus far in 2011, the offensive efficiency has stabilized at about 1.14 ppp, which is very similar to what we saw from last year's offense;
- In 2010, the defensive efficiency was very consistent at 0.92 ppp from game 6 to the end. The defensive efficiency never moved below the 0.90 ppp level, while in 2011, the defensive efficiency is declining [improving] and has now dropped below the 0.90 ppp level.
These trends provide a moving picture of how the team HAS PERFORMED, and they do NOT provide any assurances regarding how the team WILL PERFORM. The application of the current state of the data to future games is based entirely upon an assumption that the team will continue to play at the current average levels of performance. I make no attempt to project current rising or declining trends into the future.
The five game initial volatility provides some insight into how many games are required to establish a trend, or a change in a trend. I have found that single game events certainly do not establish any noteworthy trends. Neither do two or three consecutive games. In my opinion, changes in trends are only significant after a period of five consecutive games, but after five games, the average numbers are sufficient to support conclusions about how the team has been playing.
Submitted by Richard Cheeks
Submitted by Richard Cheeks
Go Back
Cats Easily Handle Winthrop, Move to 9-2
Copyright 2010
SugarHill Communications of Kentucky
All Rights Reserved