BIG BLUE FANS FOR
![]()
BASKETBALL
NOTE: THIS PAGE HAS NOT BEEN UPDATED FOR THE 2015 NCAA TOURNAMENT AT THIS TIME
CHECK BACK IN MARCH 2015 FOR THIS PAGE UPDATE 2014 information remains posted below


Cats Defeat Hampton In Round of 64
79-56
Advance To Round of 32
35-0
Cats Begin Their Journey
For Their 9th National Championship As:
The Number 1-Number 1 Seed
Undefeated
34-0
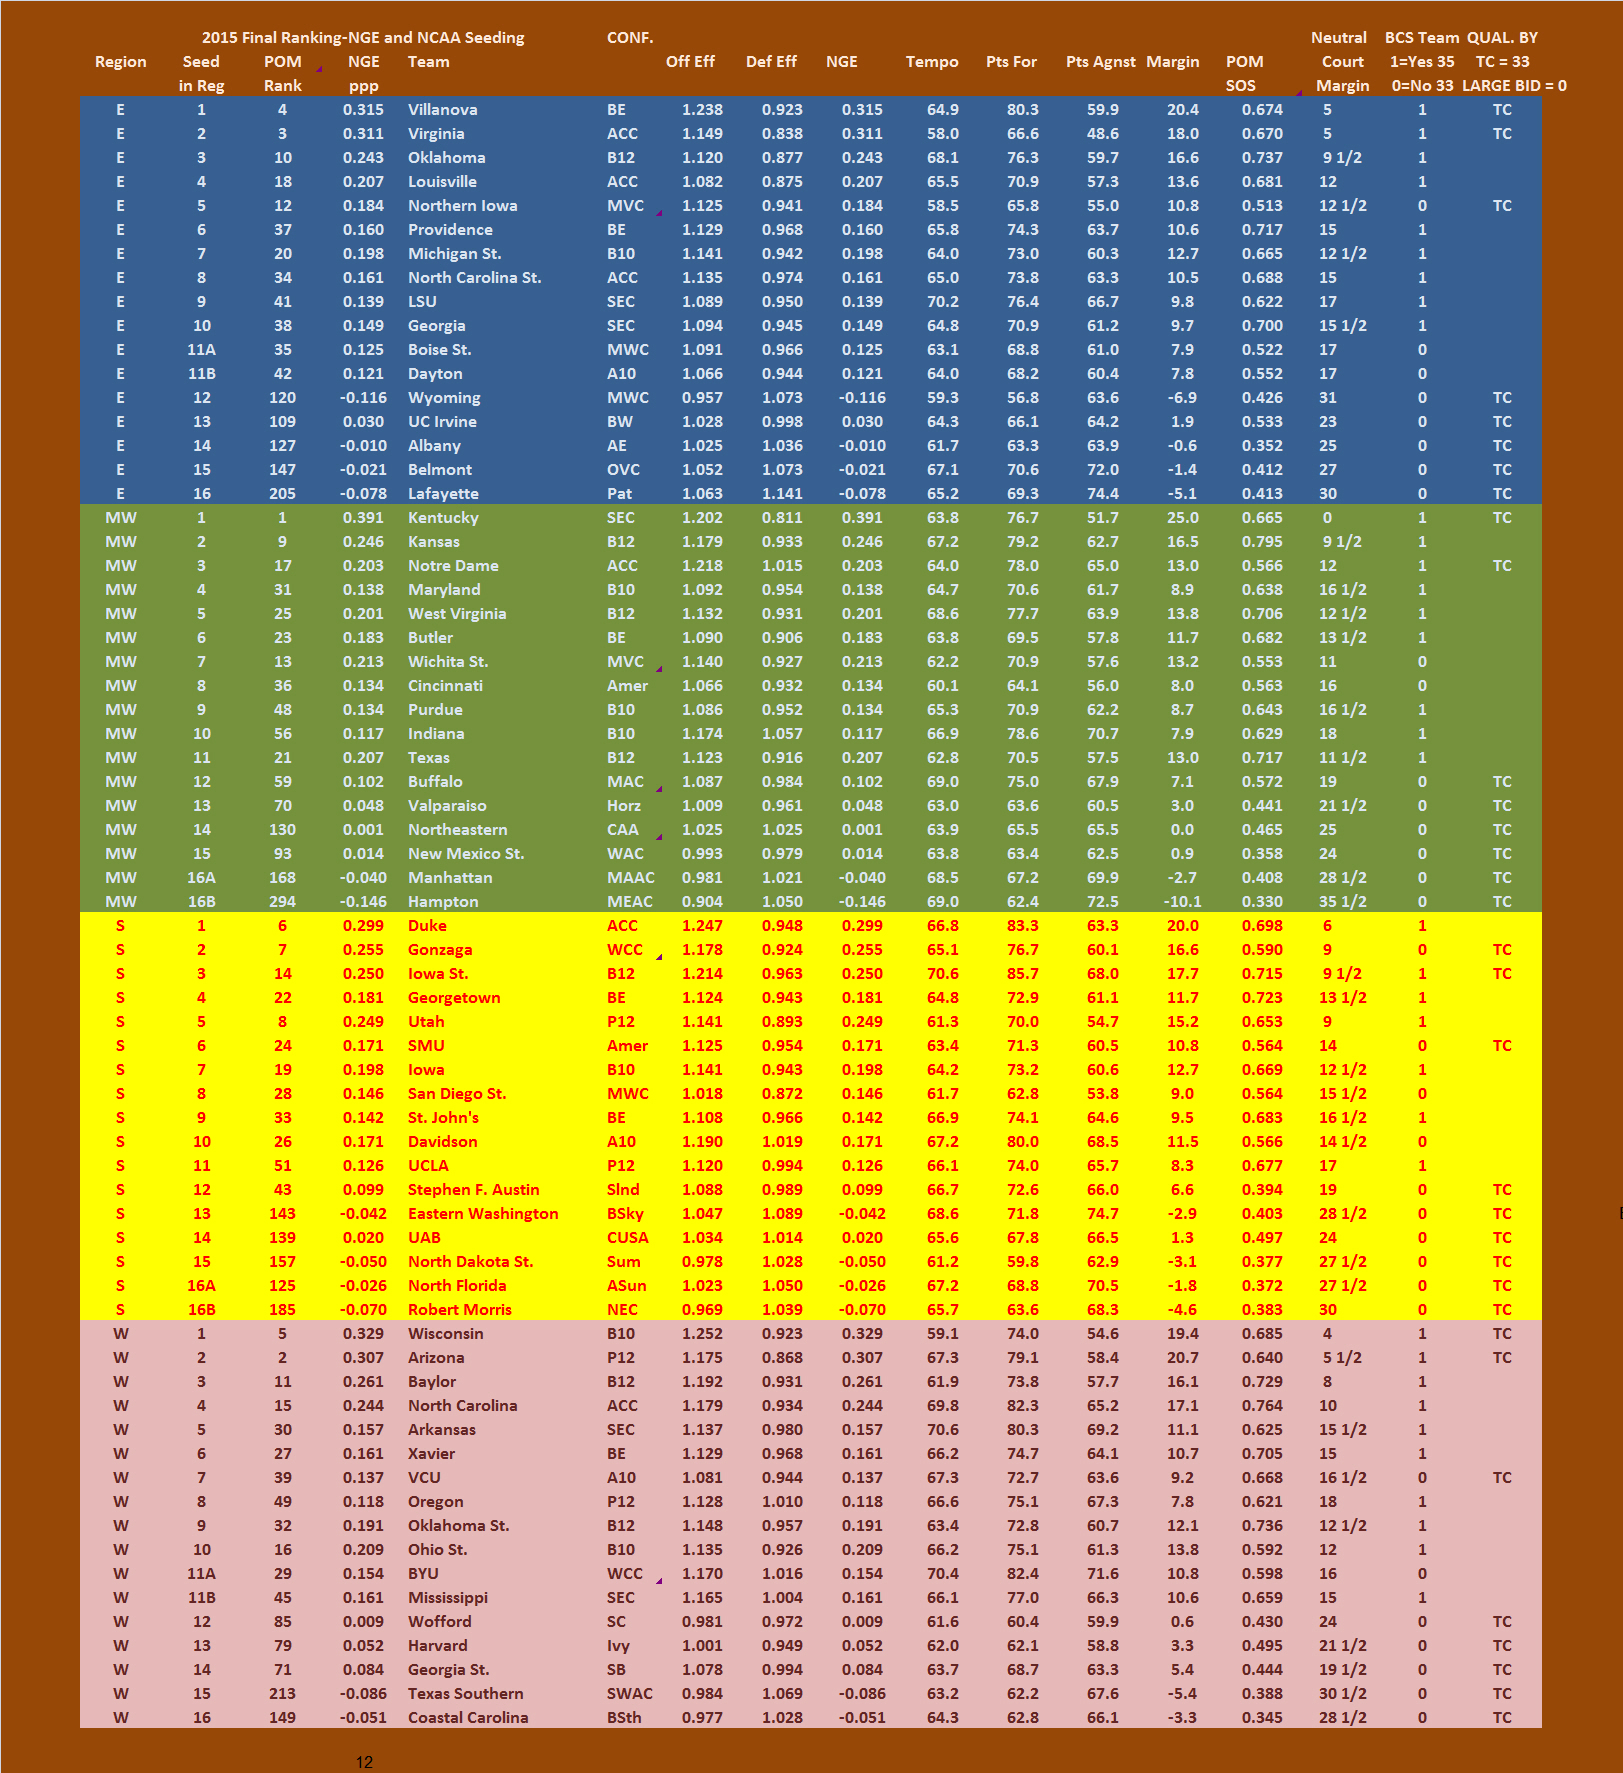
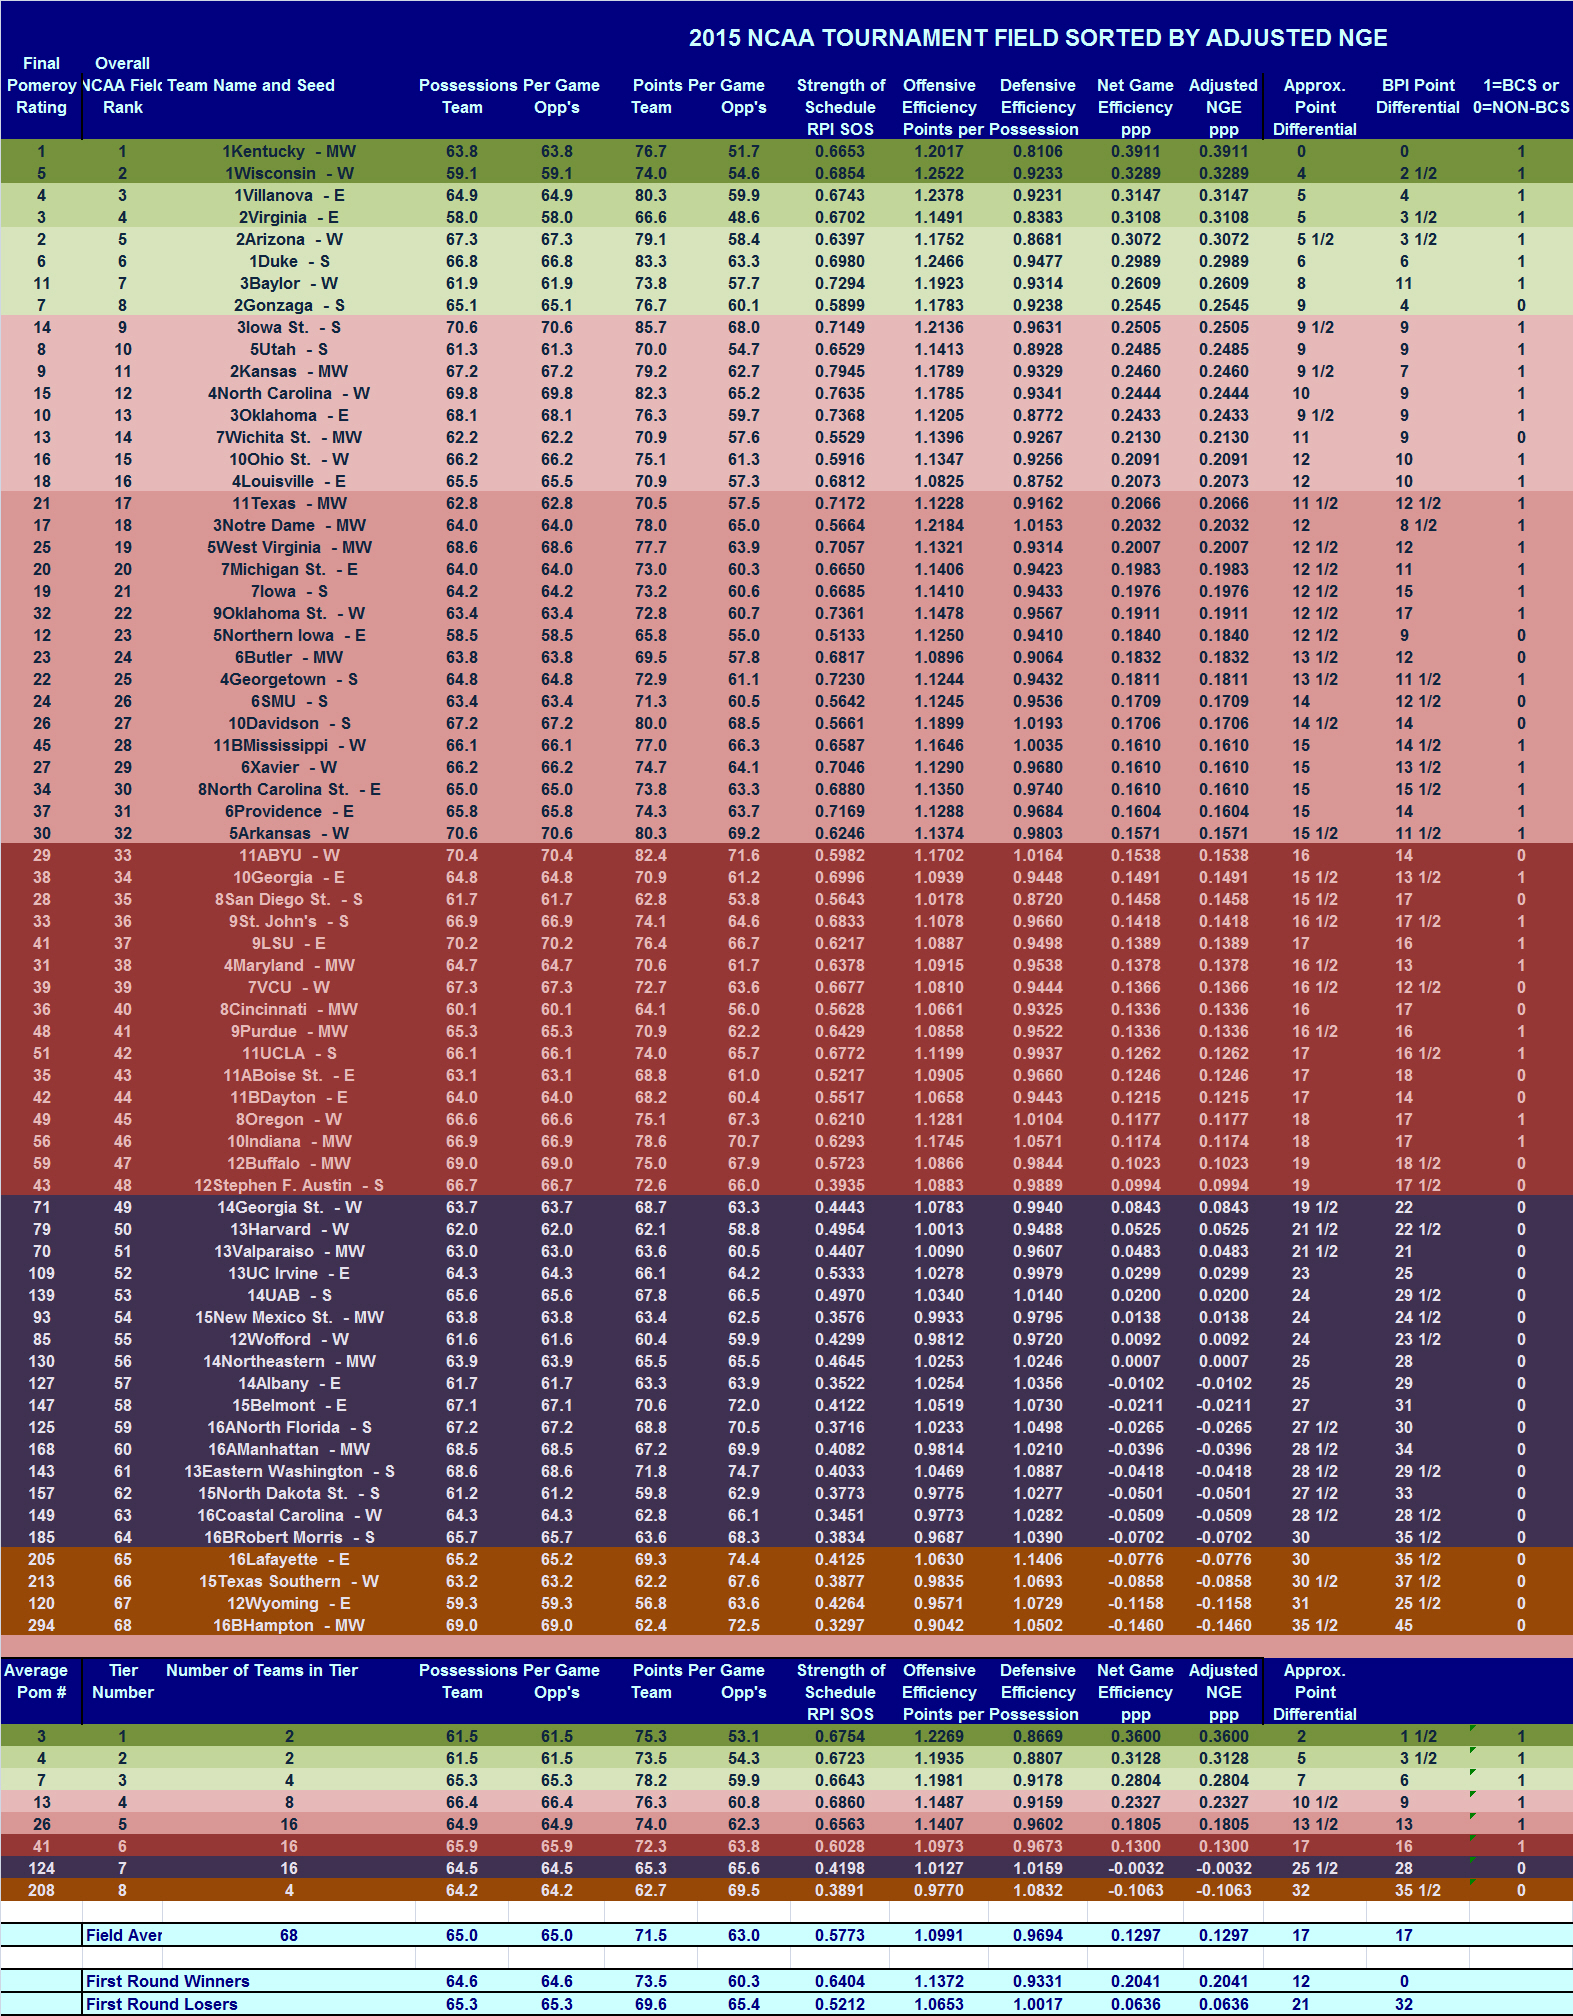
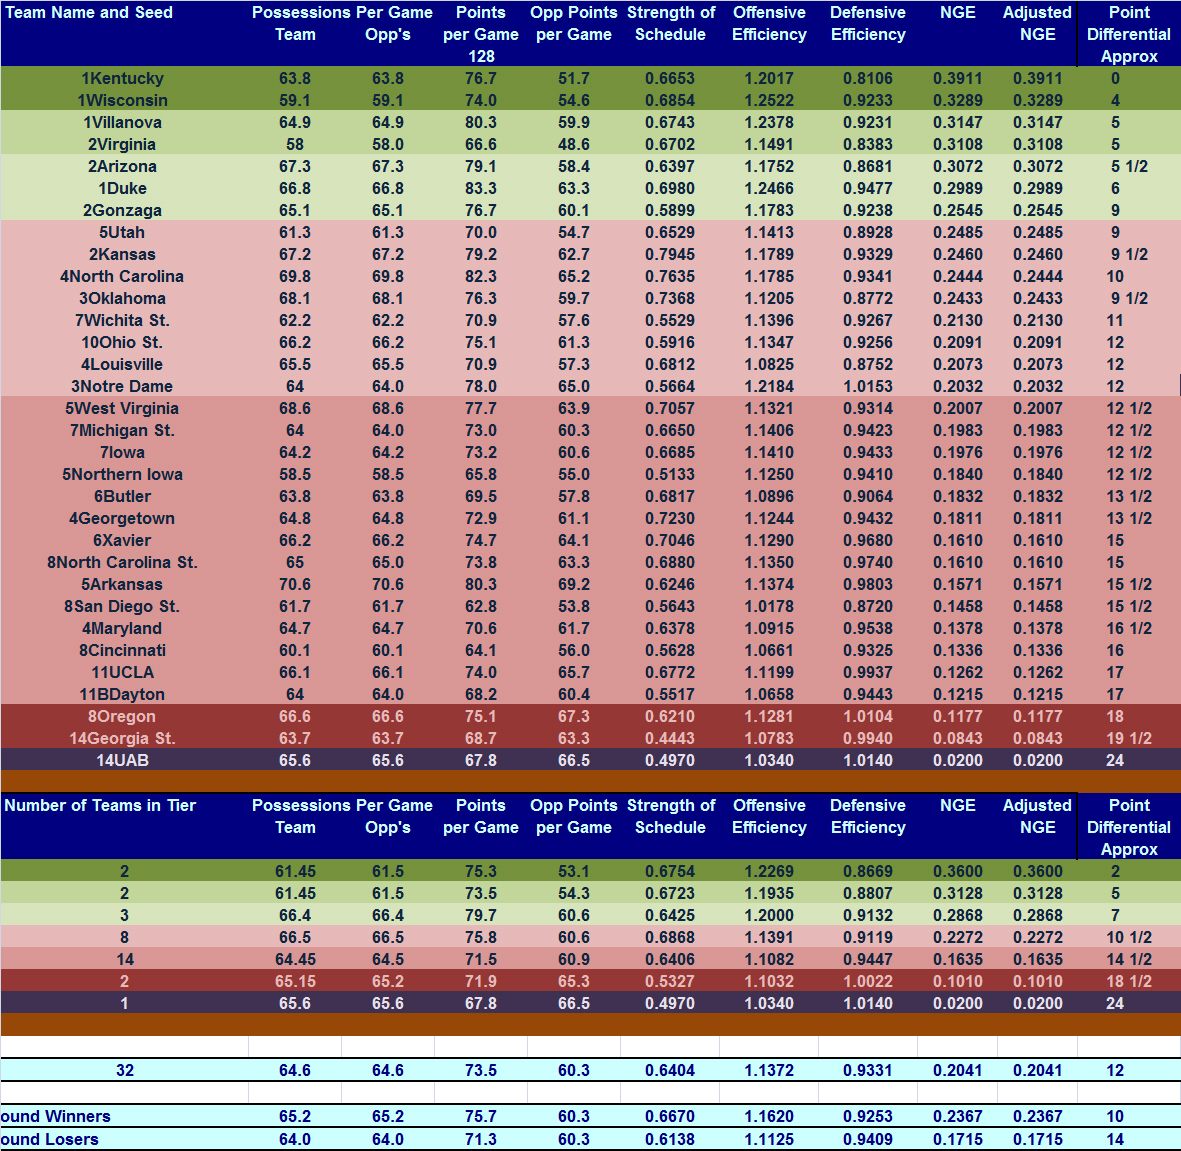
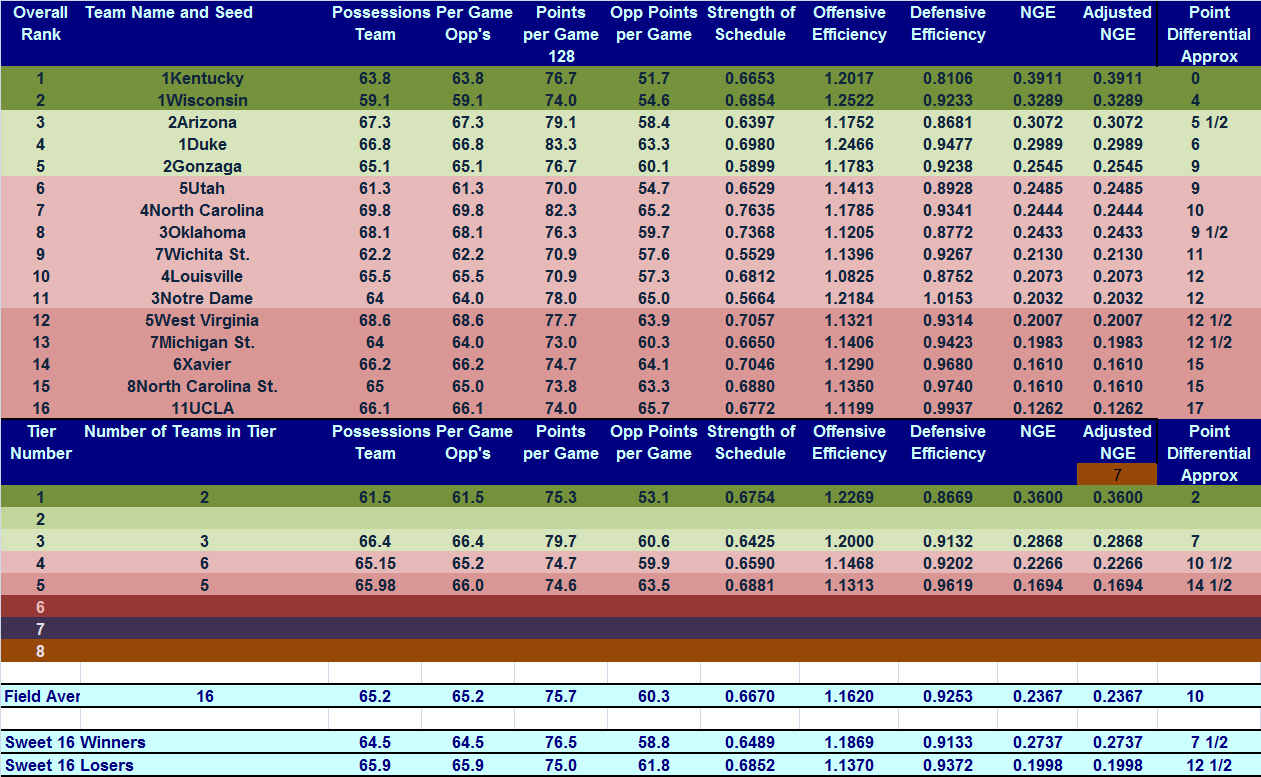
2014 NCAA TEAM DATA
AND NGE RANKING
![]()
2013 NCAA TEAM DATA
AND NGE RANKING
First Round
2013 NCAA TEAM DATA
AND NGE RANKING
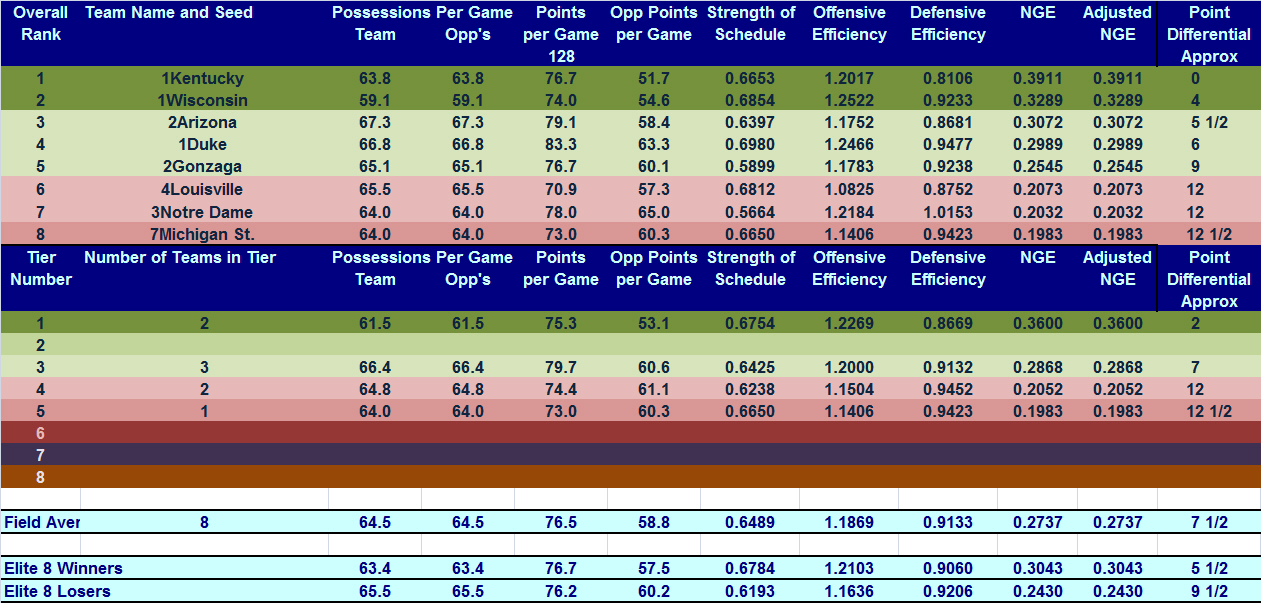
ROUND OF 32
2013 NCAA TEAM DATA
AND NGE RANKING
SWEET 16
2013 NCAA TEAM DATA
AND NGE RANKING
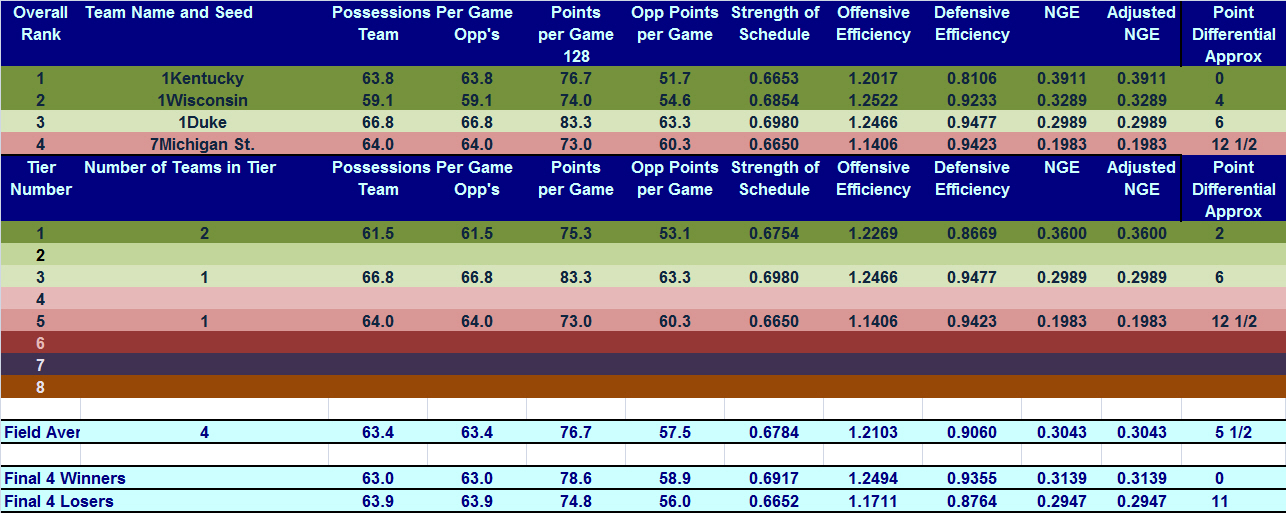
ELITE 8
2013 NCAA TEAM DATA
AND NGE RANKING
FINAL 4-PROJECTED BASED ON ADJ NGE
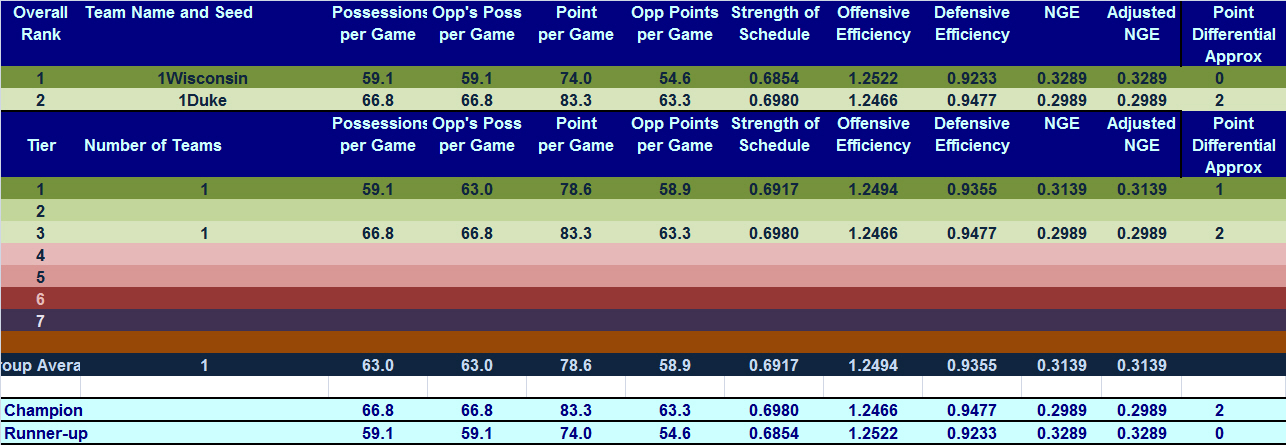
2013 NCAA TEAM DATA
AND NGE RANKING
CHAMPIONSHIP GAME-PROJECTED BASED ON ADJ NGE
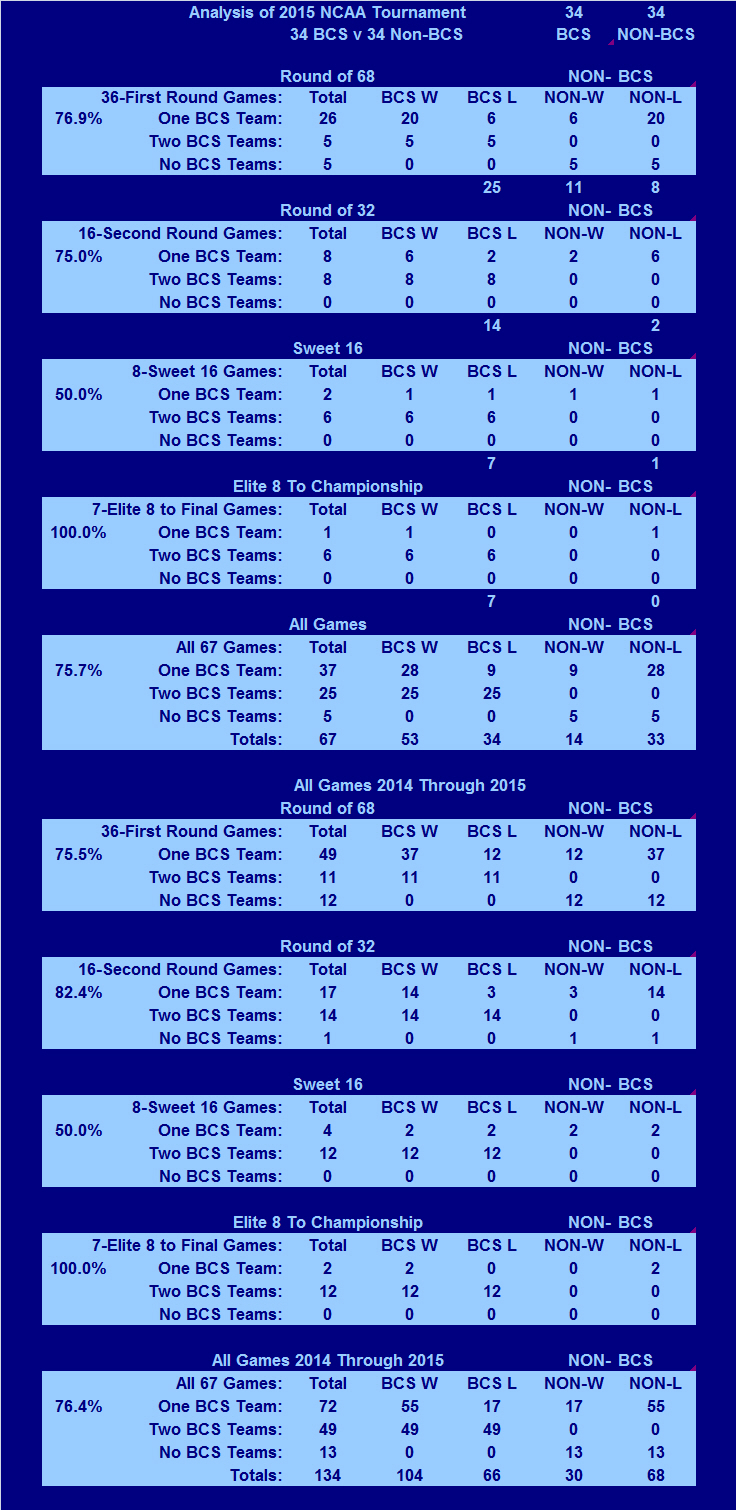
2014 NCAA Tournament
BCS vs Mid-Majors
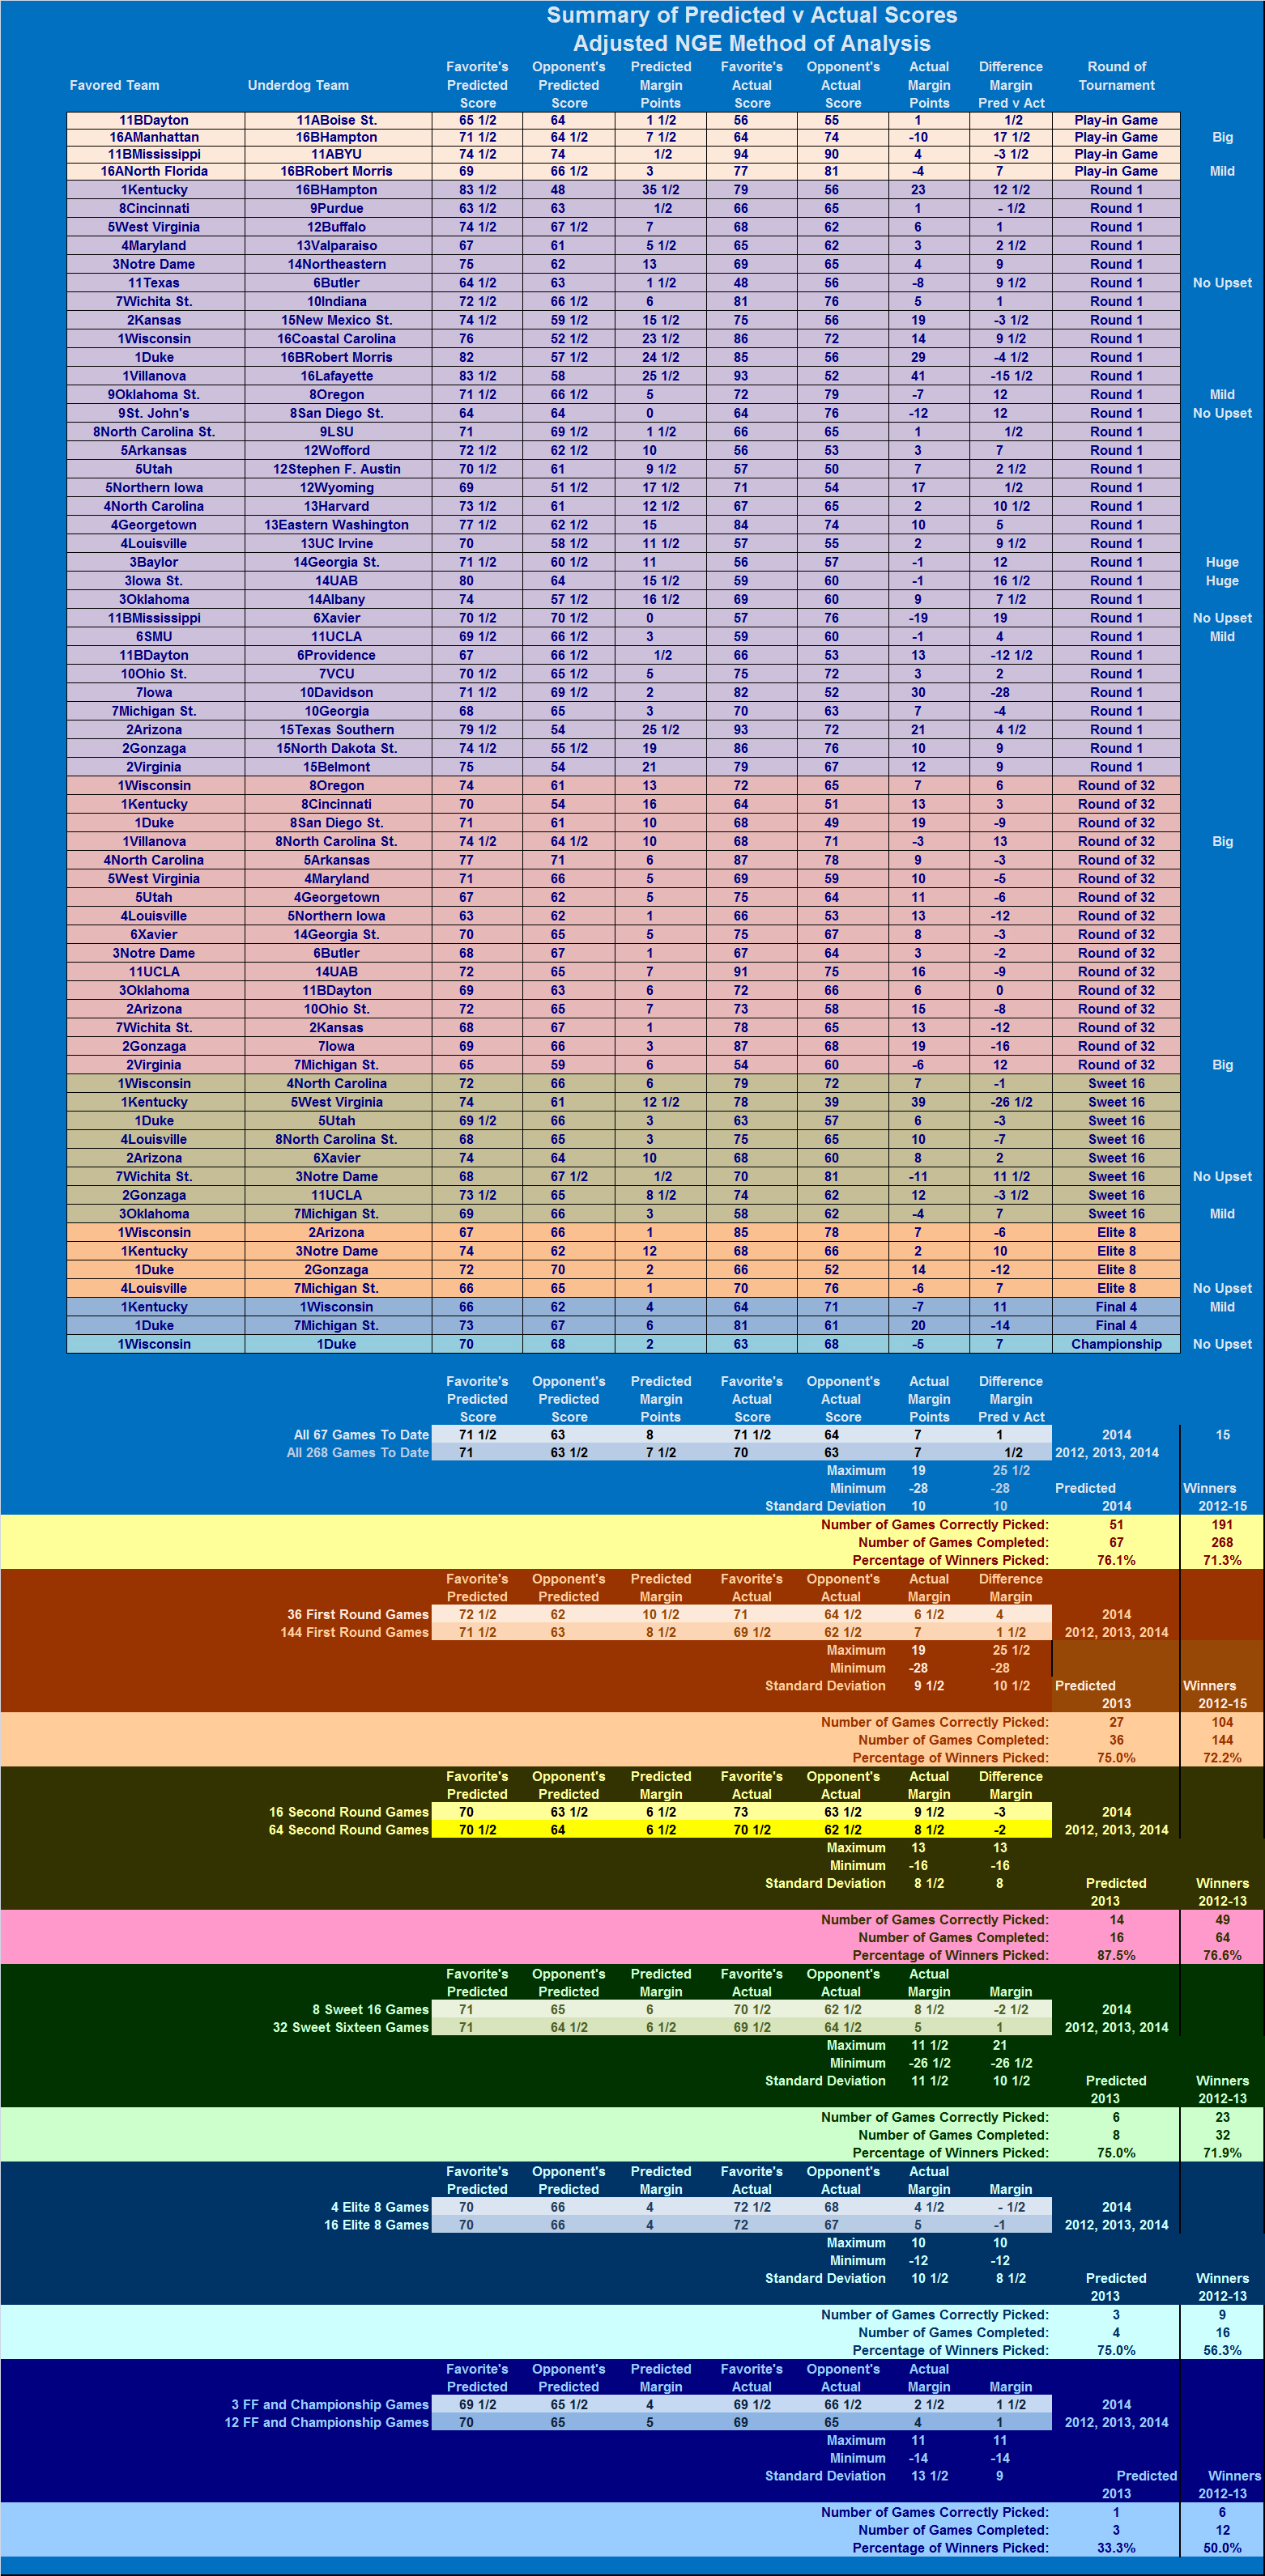
2011 SUMMARY OF PREDICTED V ACTUAL GAME BY GAME RESULTS
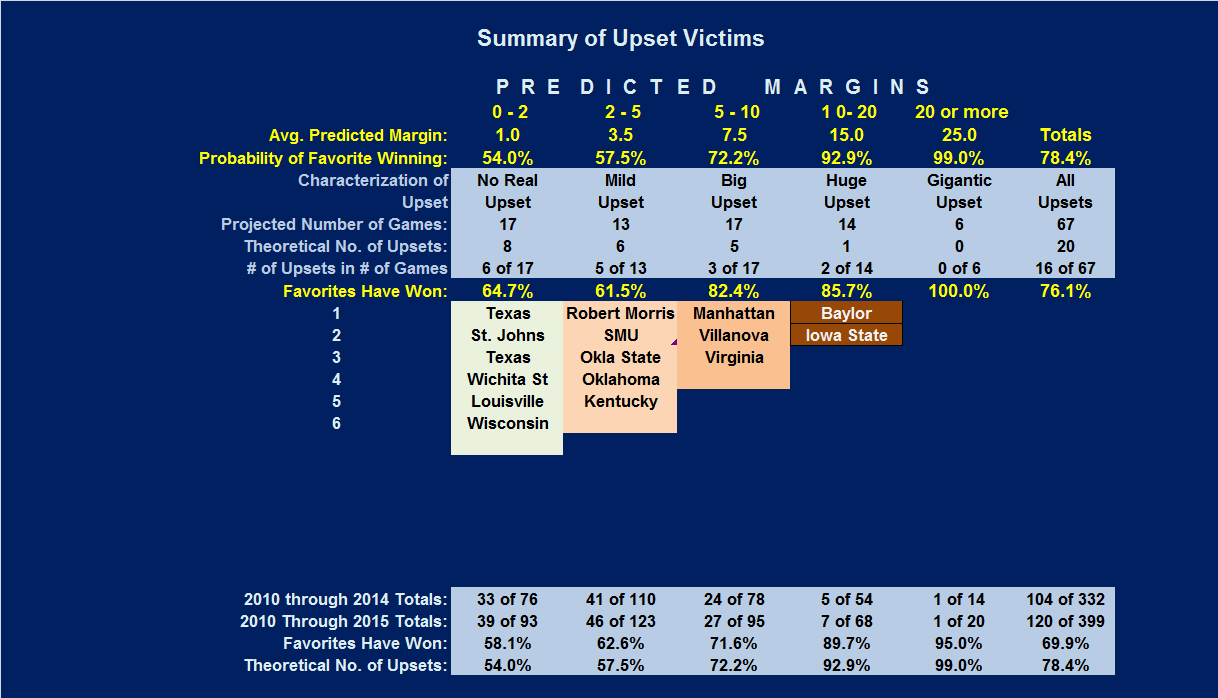
SUMMARY OF UPSET FREQUENCIES AND TOURNAMENT UPSETS
SORTED BY PREDICTED MARGINS-2011
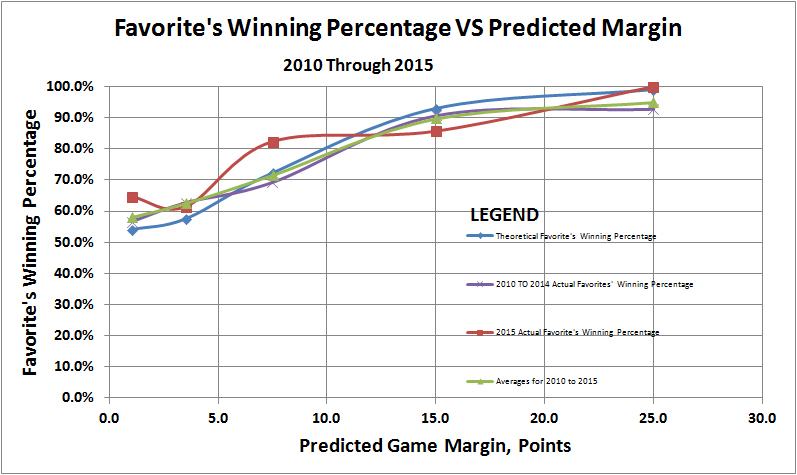
THEORETICAL V ACTUAL WINNING PERCENTAGE OF FAVORITES
AS A FUNCTION OF PREDICTED MARGIN-2011
The above data is presented in the next series of tables providing more detail in two respects. First, the tables examine more categories of statistics, and second, the data is sorted based on the following factors, in the order shown below:
You may link to any of these sorted data pages using the links above, or you can browse them in sequence using the "Continue" buttons at the bottom of each page.
1. Pace values will be lower, by the number of offensive rebounds.
2. Efficiencies will be higher due to the lower number of total possessions
3. Turnover rates will be higher due to the lower number of possessions.
CHECK OUT THESE OTHER ANALYTICAL WRITINGS
Change in Position on Definition of Possessions
Do Objective Performance Measures Like NGE
Account For Intangible?
Copyright 2008-15
SugarHill Communications of Kentucky
All Rights Reserve