BIG BLUE FANS FOR
![]()
BASKETBALL
2015-16 Season Analytical Writings
11A
THE 2015-16 UK BASKETBALL TEAM IS IN BIG TROUBLE
I track performance using a variety of measures. One of those has been looking at the game to game adjusted net efficiency. I am going to show you the graph for last season first.
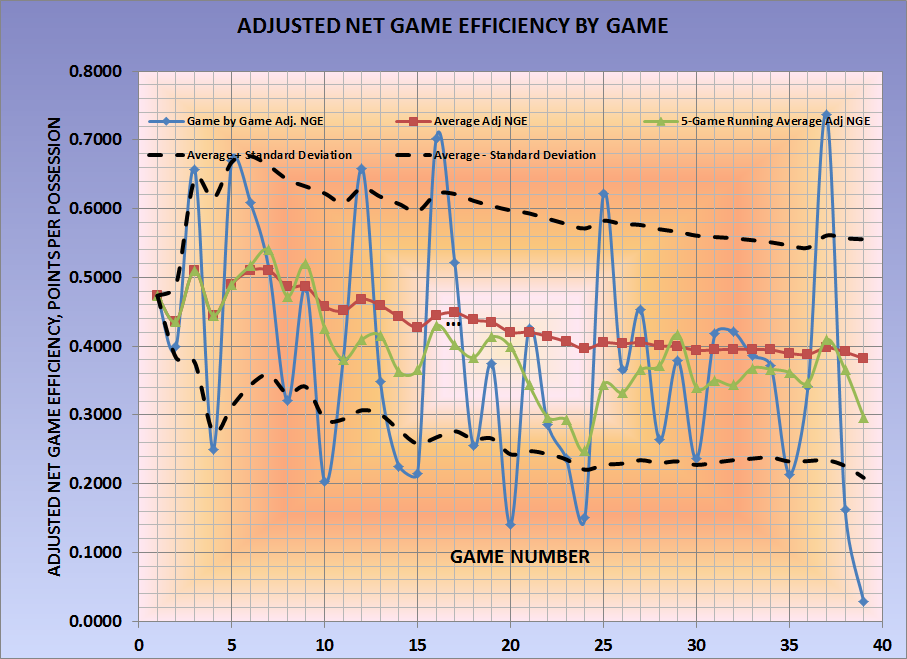
The light blue curve is the game to game adjusted net efficiency, and you can see the relatively wide swings in game performance that occurred, but off games were always offset by great games, and over the course of the season, the average net efficiency (the red curve) remained at high, championship grade levels. The light green curve is a 5 game moving average net efficiency, and you will see between games 20 and 28, there is a noticeable dip in the team's performance, but by the end of the regular season the 5-game running average returned to the approximate levels that had occurred immediately prior to the dip. That level was maintained through the SEC Tournament, but in the NCAA Tournament, the 5 game running average, and the game to game ANE fell precipitously leading to the Wisconsin loss. The black dashed lines are the average net efficiency, plus and minus one standard deviation unit. First, the standard deviation, after about 5 games, settled down and remained relatively constant for the rest of the season. Second, the games that fall above the top dashed line or below the bottom dashed line are the games in which the UK performance was significantly outside their normal range of performance, good or bad. Out of 39 games, there are 5 games above and 8 games below. That is 13 games out of 39, 1/3.
The patterns shown by the 2014-15 charting are typical of UK teams of the Calipari Era, with the only significant difference being the position of these curves on the vertical axis because admittedly the 2014-15 team had the highest average net efficiency of all Calipari UK teams. But the pattern and relationship between these various measures are like what you see above.
Now this year's early performance:
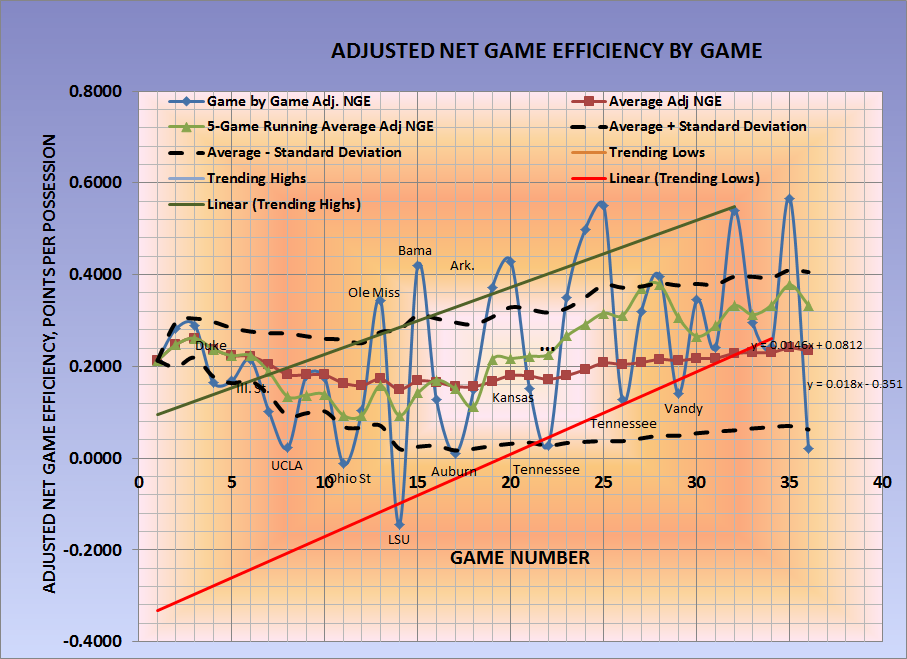
I have not seen many UK games with negative adjusted net efficiencies. An adjusted net efficiency of 0.00 represents an average performance among the entire 351 team NCAA D1 field of teams. When UK has lost games, it has done so to good teams, and the UK adjusted net efficiency in those losses are almost always above 0.00. The UCLA loss was SO BAD that the adjusted net efficiency for that game was -0.011 points per possession. The average adjusted net efficiency (red curve) appears to be in free fall. The five game running average is also in a declining trend, and the standard deviation is expanding.
All of these factors signal great trouble for this team.
Of course, the retort always is that numbers don't mean anything, blah, blah, blah. Or, this team will get better by X (you fill in the month, Jan, Feb, March, April ).
However, my experience with this since the mid 1990s has been that the statistical profile revealed by a team through the first 8 games is definitive for that team for the rest of the season. Have there been exceptions? Of course there have, but that is why they are called exceptions. Can 2015-16 be one of those exceptional years, of course it can, but the probability is against that happening.
I am sounding the alarm. This team is in BIG trouble.
This UK team at this time is but a shell of the type of team we have grown accustomed to watching and enjoying. Pre-season, based on an average Calipari team at UK, I projected 2 regular season losses, to Duke and to Kansas. Now that we have 8 games on the books, the statistical profile of this team is becoming apparent to all, and the projection for the season now indicates 9 losses in the regular season, and that places this team in jeopardy of NOT getting one of those precious double byes in the SECT, and losing 10 or more games this season.
As most Big Blue Fans recall, 10 or more losses has been the mark of judgement upon a team, a season, and a coach (Ten Loss Tubby became the rally cry for his removal a decade ago).
Now, former players from the Calipari era are sounding the alarm. This is good for the program, and good for this team. A decade ago, when Tubby Smith had taken the program from the top to mediocrity, calls or concern from former players, coaches, and media were virtually nonexistent. We need our former players holding their successor players to the high standards that the former players worked so hard to maintain and establish as the norm for the great UK program. We need the UK sports press corps to hold these standards as significant and aske the coaches and players to be accountable.
Tyler Ulis understands all of this, and is driven by a personal desire to be a winner. Thankfully, Tyler is a member of this team.
Go Big Blue. It is past time for this group of Wildcats to understand that the program is bigger than any of them, and their obligation to the program are important. They wear the blue and white and have a responsibility to the program.
Submitted by Richard Cheeks
Submitted by Richard Cheeks
Copyright 2015
SugarHill Communications of Kentucky
All Rights Reserved