BIG BLUE FANS FOR
BASKETBALL
11A
WHAT CAN WE READ IN THE TEA LEAVES AFTER THE FIRST FIVE GAMES?
For many years, I have observed that the ANE value the Cats post through the first 5 games (ANE 5 ) has been an excellent indicator of how the season will end. Each time I share this idea, people have greeted it with near universal criticism. Some have said it is so far off base as to be laughable. The critics often have contended that there is no way to know how a team will develop. In addition, the critics always have argued that the team will be so much different in March than it is in November; therefore, there can be no correlation between how the team has played in November and how the team will play in March.
While these criticisms appear valid on the surface, the criticisms do not withstand scrutiny when this predictive methodology is compared to the season outcomes. The rocky start that we have witnessed in the 2017-18 season has once again raised questions about what it may bode for the future of this team.
• Has this season's start really been slower than the other Calipari Era teams?
• What, if anything, does that mean for the remainder of this season?
• How will this team develop over the course of the season?
• How this team will finish its journey in March.
The short answers are (1) Yes, and (2) This team should continue to improve, but it is unlikely that this team will improve sufficiently to be a legitimate contender for the Championship in March. Here are the details of this analysis.
The following table shows the data for the Calipari Era first five games. The total scoring and possession data produces the RNE values. The venue and opponent strength adjustments convert the ANE 5 into the ANE 5 values. I have obtained the ANE FINAL values from Pomeroy's Database.
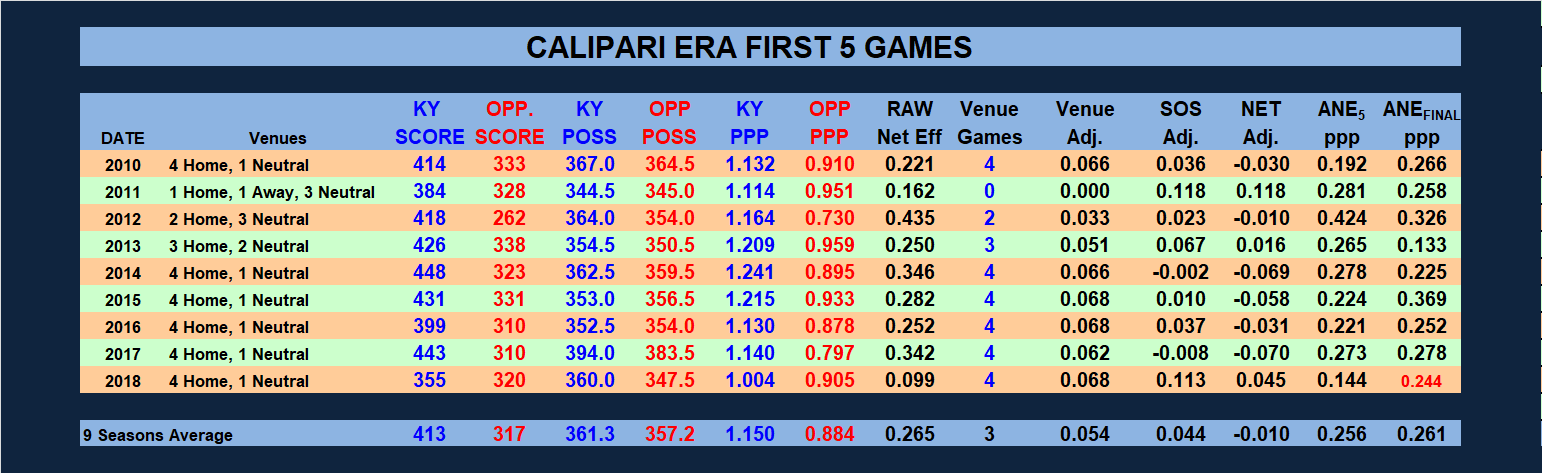
Clearly, this team's RNE 5 is the lowest of the Calipari Era, and frankly, it is not even. This year's team has posted a RNE 5 of 0.099 points per possession. The next lowest start for RNE 5 occurred in 2010-11 at 0.162 ppp, and the Calipari teams have averaged an RNE 5 of 0.265 ppp after their first five games. The three strongest starts based on RNE 5 were in 2011-12 (0.435 ppp), 2013-14 (0.346 ppp), and 2016-17 (0.342 ppp).
The most common explanation for the slow start has been the youth/inexperience of this roster, but another equally significant explanation for the low RNE 5 is the strength of this season's early schedule. It has been the second strongest first five opponents, taken together, of the Calipari Era. Only the start of 2011-12 included a strong array of opponents. When a venue adjustment is added to the opponent strength adjustment, this season remains the second most difficult opening, second only to that same 2010-11 season start. One can see the impact opponent strength by comparing the RNE 5 values to the ANE 5 , adjusted for Venue and Opponent Strength.
While this year's RNE 5 has been the lowest by a huge amount, the ANE 5 this season remains the lowest, but the differences are more subtle. This year's ANE 5 has been 0.144 ppp, and the next lowest ANE through five games was 2009-10 at 0.192 ppp. The average ANE 5 during the Calipari Era has been 0.260 ppp. While the 2018 ANE 5 remains the lowest of the Calipari Era after the first five games, the separation between 2010's ANE 5 and the 2018 ANE 5 has narrowed.
Four of Coach Calipari's eight teams have improved their ANE between game five and the end of the season, and the other four have experienced declines. The change in the ANE value over the course of the season is a function of to the ANE 5 value as shown below. The horizontal axis of this graph is the ANE 5 for the season, and the vertical axis is the difference between ANE FINAL and ANE 5 for the same season. A positive value on the vertical axis indicates a team that improved its ANE value after game 5 and a negative value on the vertical axis indicates a team that saw its ANE valued decline after game 5.
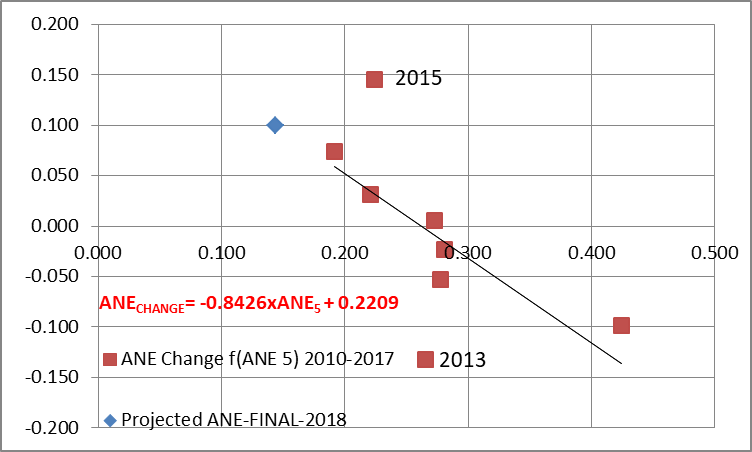
Six of the eight Calipari team performed very close to the trend line shown on the graph, and two teams have departed significantly from this relationship. Notice that the trend line crosses has a value of 0.000 ppp when the ANE 5 value is about equal to the Average value of ANE 5 for the Calipari Era. The two-outlier seasons are 2013 and 2015. In 2015, the team ended with an ANE FINAL significantly higher than their ANE 5 value would indicate based on the trend line. In 2013, the team ended with an ANE FINAL significantly lower than their ANE 5 value would indicate based on the trend line.
The trend indicates that when the team gets off to a very strong start (better than the Calipari Era Average), the team tends to yield some ground over the course of the season, thus a lower ANE FINAL value than the ANE 5 value. Conversely, when the team gets off to a relatively slow start (less than the Calipari Era Average), the team tends to pick up some ground over the course of the season. Based on the first five games this season, the ANE 5 for 2018 is 0.144 ppp. Using this trend, the projected final ANE for the 2018 team should be about 0.247 ppp.
There is a relatively tight and repeatable relationship between a team's ANE FINAL and its final rank based solely on ANE FINAL . It is important to note here that rank in accordance with ANE FINAL is not the same as ranking based on subjective polling, or ranking suggested by the NCAA tournament seeding. Here is the data for 2010 through 2017 for the top 10 spots, and every fifth spot to #40, and every tenth spot to #60.
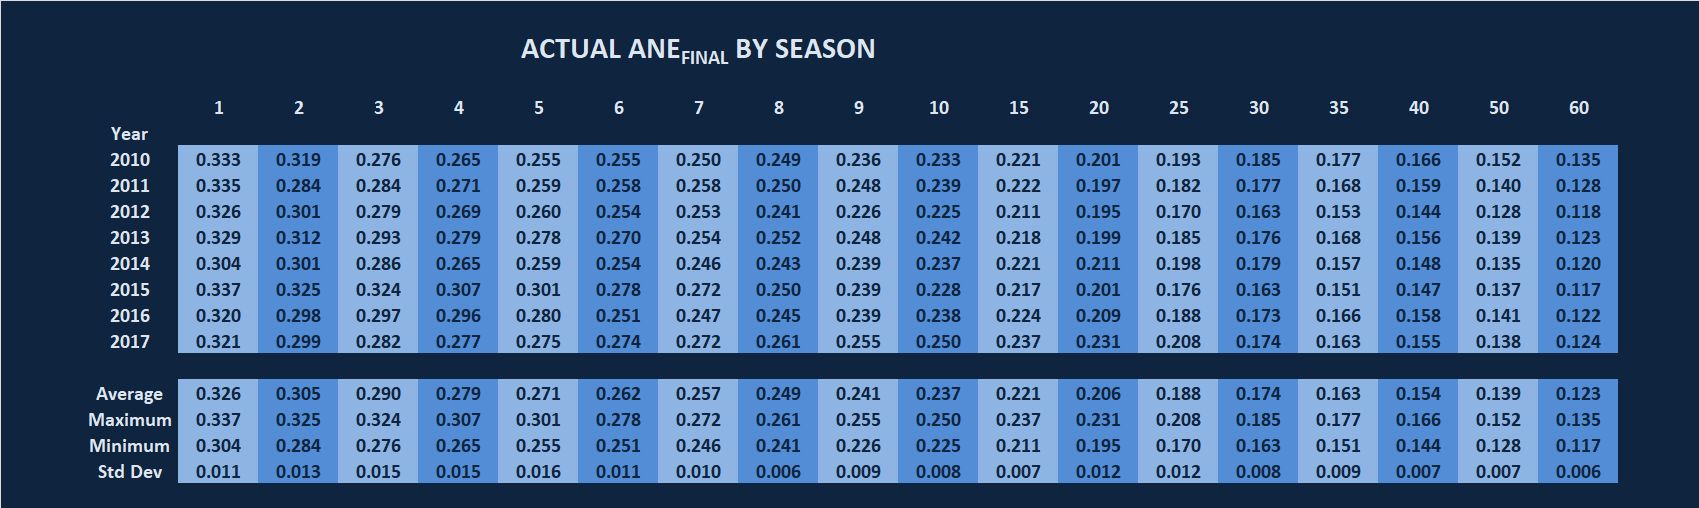
Click on Table For Readable View
Here is this data presented in graphical form. The blue line represents the average of all data.
![]()
As noted above, the projected ANE FINAL for 2018 is 0.247 ppp. Using the relationship between ANE FINAL and efficiency based rank, an ANE FINAL of 0.247 ppp corresponds to a rank between #8 and #10, i.e. #9, a Sweet 16 quality team.
How does this same relationship work for the 2010 through 2017 UK teams? How well has this methodology predicted the end of season results for the Calipari Era teams? See below:
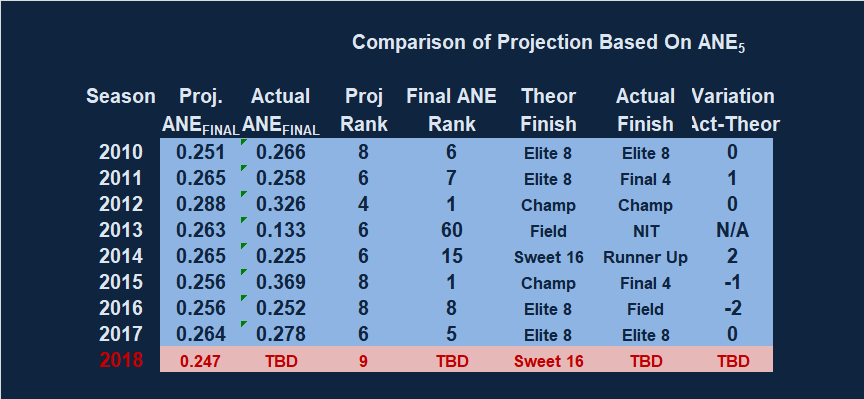
The variation column on this table is the number of NCAA Tournament rounds between the theoretical finish and the actual finish. If a projected finish is Final 4 and the team ends its season in the Final 4, then the variation value is zero. However, if that team makes it to the Championship game, then the column contains 1. If that same team exits in the Sweet 16, then the column contains a -1. Of the seven Calipari teams that competed in the NCAA, three have finished just as projected (2010, 2012, and 2017), two have over performed the projection (2011 and 2014), and two have underperformed the projection (2015 and 2016).
Based on this analysis, this team should develop into a Sweet 16 type team by year-end. Such a team could advance to the Elite 8 before falling out, or exit early, in the Round of 32. A run at the championship in the Final 4 or an exit in the first round of the tournament is not a likely outcome for this team based on these historical relationships and results.
Submitted by Richard Cheeks
Submitted by Richard Cheeks
![]()
To Cats Take On Illinois-Chicago
Go Back
To Cats Stumble Over Finish Line Again Against Fort Wayne
Copyright 2017
SugarHill Communications of Kentucky
All Rights Reserved