BIG BLUE FANS FOR
BASKETBALL
42A
HOW RELIABLE WERE THOSE BLASTED TEA LEAVES
IN NOVEMBER AFTER THE FIRST FIVE GAMES?
Back on November 23, 2017, after the 2017-18 Cats had completed their first five game, I dared to look into the pot and read the tea leaves that had settled out after those initial games by this team. The 2017-18 season is now completely in the books and a look back at that November reading may be helpful. To be sure, this is far from an exact science. Nevertheless, the forecast for this team in November included the following elements that one can compare to the manner in which this season actually played out and ended.
The bottom line conclusion in November was, Based on this analysis, this team should develop into a Sweet 16 type team by year-end. Such a team could advance to the Elite 8 before falling out, or exit early, in the Round of 32. A run at the championship in the Final 4 or an exit in the first round of the tournament is not a likely outcome for this team based on these historical relationships and results. With all the twists and turns that occurred between games 6 and 37, this forecast has proven eerily prescient. Despite the criticism of the idea that a team's performance over the first 5 games can be indicative of how the team will finish its season, the results over the last 9 seasons are more consistent with this thesis than contrary, and this season has been no different.
The 2017-18 team had the slowest start of any team in the Calipari Era, and it finished with the lowest ANE of all the Calipari teams except 2012-13, and everyone should understand that the 2013 finish is anomalous due to the total collapse that team experienced following Nerlens Noel's season ending injury. My view remains the same, the 2017-18 team is the weakest team of the Calipari Era, and was so at the start and at the finish line. Table 1 provides the data for the Calipari Era.
Table 1
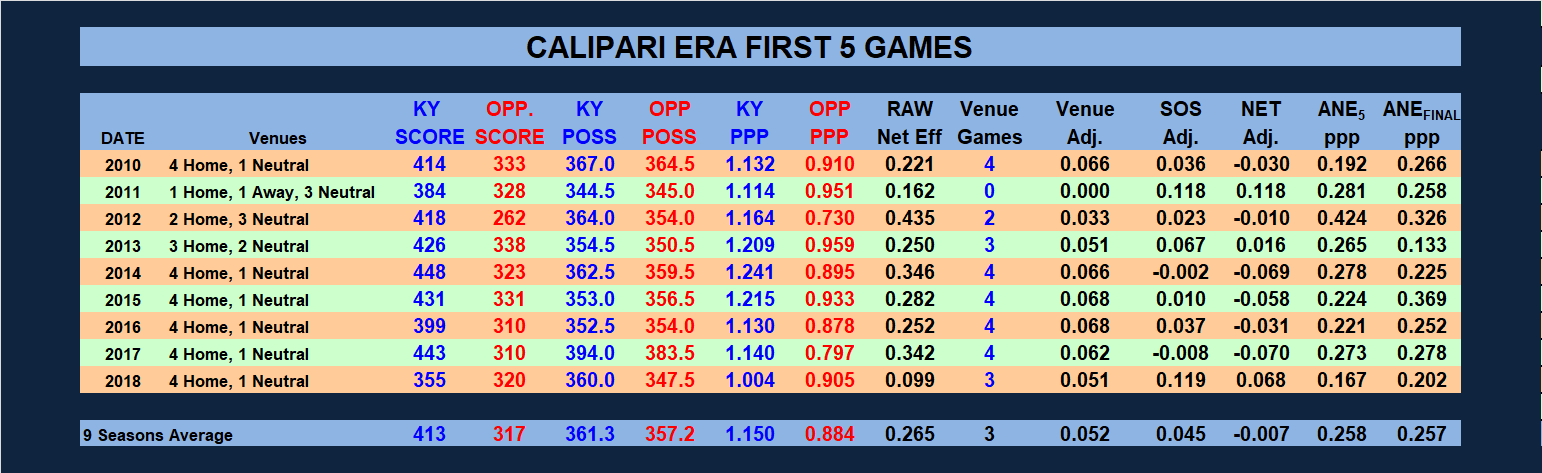
Five of Coach Calipari's nine teams have improved their ANE between game five and the end of the season, and the other four have experienced declines. The change in the ANE value over the course of the season is a function of to the ANE 5 value as shown below. The horizontal axis of this graph is the ANE 5 for the season, and the vertical axis is the difference between ANE FINAL and ANE 5 for the same season. A positive value on the vertical axis indicates a team that improved its ANE value after game 5 and a negative value on the vertical axis indicates a team that saw its ANE valued decline after game 5. Figure 1 shows the relationship for Coach Calipari's nine UK teams. Notice that the trend line crosses has a value of 0.000 ppp when the ANE 5 value is about equal to the Average value of ANE 5 for the Calipari Era.
Figure 1
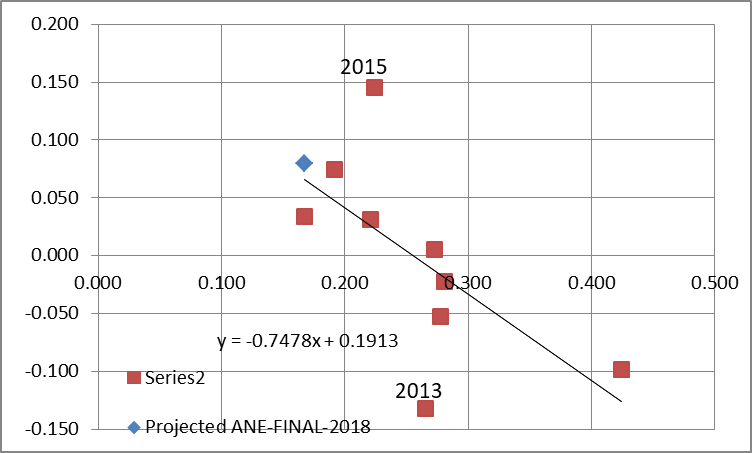
As this Figure illustrates, seven of the nine Calipari team performed very close to the trend line shown on the graph. Two teams have departed significantly from this relationship. The two-outlier seasons are 2013 and 2015. In 2015, the team ended with an ANE FINAL significantly higher than their ANE 5 value would indicate based on the trend line. In 2013, the team ended with an ANE FINAL significantly lower than their ANE 5 value would indicate based on the trend line.
The trend indicates that when the team gets off to a very strong start (better than the Calipari Era Average), the team tends to yield some ground from its strong start over the course of the season, thus a lower ANE FINAL value than the ANE 5 value. Conversely, when the team gets off to a relatively slow start (less than the Calipari Era Average), the team tends to pick up some ground from its weak start over the course of the season. The 2017-18 season long trend was consistent with these observations, but the amount of net improvement that this team posted between games 6 and 37 was less than the model projected. The blue diamond represents the November (5 game) projection of the change this team should make, and the red square below the blue diamond is the actual amount of improvement achieved by this team.
There is a relatively tight and repeatable relationship between a team's ANE FINAL and its final rank based solely on ANE FINAL . Table 2 provides all of the data during the Calipari Era. It is important to note here that rank in accordance with ANE FINAL is not the same as ranking based on subjective polling, or ranking suggested by the NCAA tournament seeding. Here is the data for 2010 through 2017 for the top 10 spots, and every fifth spot to #40, and every tenth spot to #60.
Table 2
![]()
Figure 2 presents this same data in graphical form. The blue line represents the average of all data and the red and green lines indicate the minimum and maximum ANE values for each respective ranking for 2010 through 2018.
Figure 2
![]()
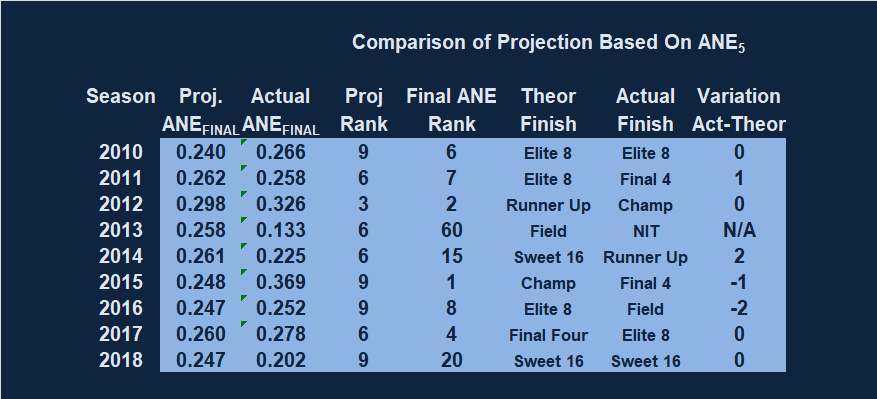
In November, the projected ANE FINAL for 2018 was 0.247 ppp. Using the relationship between ANE FINAL and efficiency based rank, an ANE FINAL of 0.244 ppp corresponds to a rank of #9, a clear Sweet 16 quality team with a legitimate claim on a spot in the Elite 8. The ANE FINAL for this team is 0.204 ppp, which corresponds to a final ANE rank of #20, a round of 32 quality team with a legitimate claim on a spot in the Sweet 16.
Table 3 summarizes the Calipari Era projected and actual results. The variation column on this table is the number of NCAA Tournament rounds between the theoretical finish and the actual finish. If a projected finish is Final 4 and the team ends its season in the Final 4, then the variation value is zero. However, if that team makes it to the Championship game, then the column contains 1. If that same team exits in the Sweet 16, then the column contains a -1. Of the eight Calipari teams that competed in the NCAA, four have finished just as projected (2010, 2012, 2017, and 2018), two have over performed the projection (2011 and 2014), and two have underperformed the projection (2015 and 2016).
Table 3
All games are important regardless of the quality of the opponent, the location of the game, or the timing of the game within the course of the season. These trends and analyses indicate that Calipari's teams are giving their best effort from the beginning, regardless of their experience mix of the roster, the venue, or the opponent. This data also indicate that the way a team starts a season provides reliable insight regarding how that team will finish the season.
Submitted by Richard Cheeks
Submitted by Richard Cheeks
Go Back
To Cats Fall To Kansas State In Sweet 16
Copyright 2018
SugarHill Communications of Kentucky
All Rights Reserved