CONCERNED FANS FOR
![]()
BASKETBALL
WHAT HAPPENS TO UK BASKETBALL
AFTER 5 MORE YEARS OF TUBBY SMITH?
In another post, I examined the actual results of the Pitino and Smith tenures at UK, and demonstrated that since Tubby Smith's arrival, offensive efficiency dropped and stabilized at about 0.90 ppp while the defensive efficiency immediately jumped, and has continued to rise over the last 9 years. These data are repeated below on the two graphs. Click Here to read the prior article.
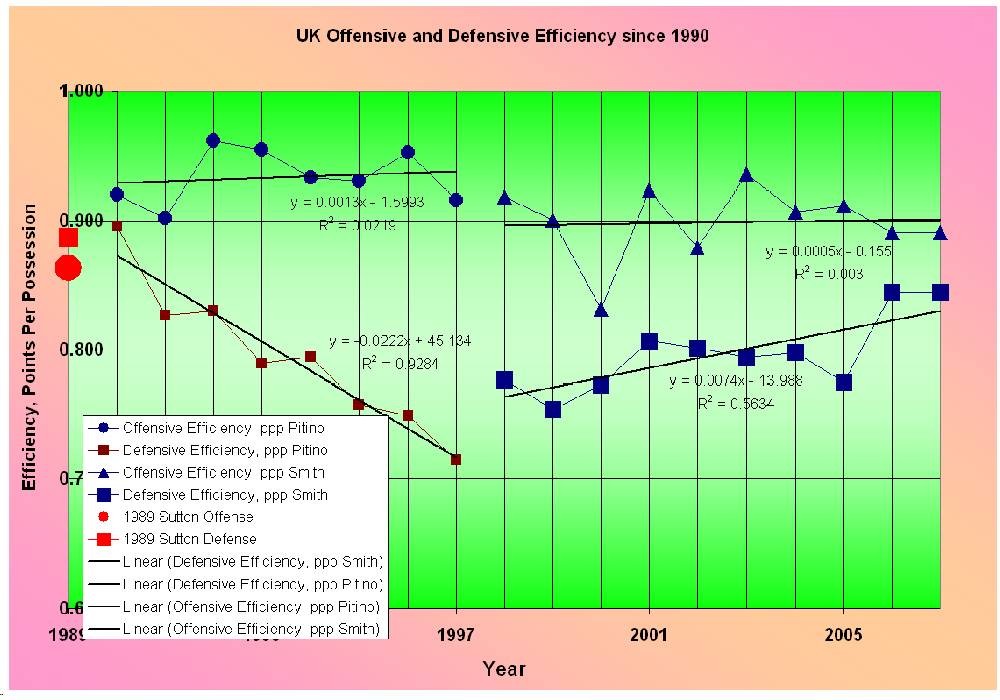
What do these trends suggest for UK's next 5 years with Tubby Smith remaining at the helm?
Some people are asserting that next year, UK will be better than last year. Well, I would certainly hope so, and there is an historical basis for that expectation. However, even if that does occur, that "gain" is likely a temporary one along a path of steady overall decline.
When I look back over the last season, 13 losses, the loss of 4 seniors and 4 early outs, with unknown, unproven freshmen coming in, I am concerned about offensive and defensive efficiency for the coming year, and could envision an even poorer performance next year than this year. Nonetheless, Tubby's UK history tells differently.
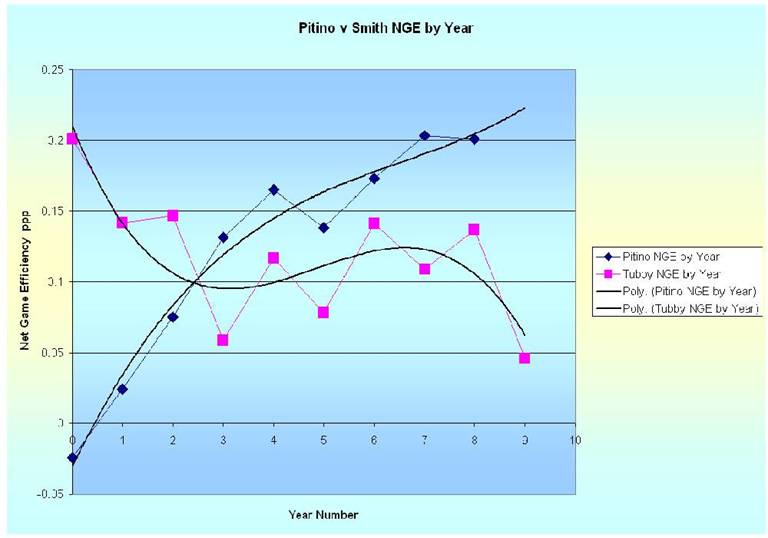
This last season was Tubby's worst of 9 at UK, ending the season with a NGE of only 0.043 ppp. This was a drop of almost 0.09 ppp from the 05 results. Tubby's years have been marked by alternating improvement and decline in the NGE for the year. Below are the Year to Year Change in NGE for each of Tubby's 9 teams in reverse sequence, 2006-1998. For 1998, the final NGE for 1997 is used for the starting point.
Year 1 1997 to 1998 -0.059
Year 2 1998 to 1999 0.005 Two Year Change -0.054
Year 3 1999 to 2000 -0.088
Year 4 2000 to 2001 0.058 Two Year Change -0.030; Avg Two Year Change -0.042
Year 5 2001 to 2002 -0.039
Year 6 2002 to 2003 0.063 Two Year Change +0.024; Avg Two Year Change -0.020
Year 7 2003 to 2004 -0.032
Year 8 2004 to 2005 0.028 Two Year Change -0.004; Avg Two Year Change -0.016
Year 9 2005 to 2006 -0.091 Projected Two Year Change through 07 -0.055; Avg Two Year Change -0.024
So, 5 of the 9 years saw the UK team play poorer than the year before, and the intervening 4 years saw the performance improve. The year to year declines [5 seasons] have a maximum decline of 0.091 ppp [2006] and a minimum decline of 0.032 ppp [2004]. The average of the five (5) declining years was a decline of 0.062 ppp.
In contrast, the 4 years of improved performance from the prior years, the maximum improvement was 0.063 ppp [2003], the minimum improvement was 0.005 ppp [1999], and the average improvement for these 4 "up" years was an improvement of 0.039 ppp.
Therefore, on average, each two year cycle corresponds to a net decline in UK's performance by 0.024 ppp. With a year ending NGE = 0.043 ppp in 2006, UK is only two more two-year cycles away from a negative NGE, which corresponds to a losing record.
If the alternating pattern that Tubby has established over the first 9 years continues over the duration of his contract, 2011 season, it would be 07 up, 08 down, 09 up, 10 down, and 11 up. If the averages for the Ups and Downs prevail over these future cycles, the NGE for each of these remaining years would be:
2007 0.082 Projected Win % 72%
2008 0.020 Projected Win % 53%
2009 0.059 Projected Win % 68%
2010 -0.004 Projected Win % 49%
2011 0.035 Projected Win % 56%
Based on these projections, the preceding plot of NGE for the Tubby Smith era, projected to the end of his current contract is shown below:
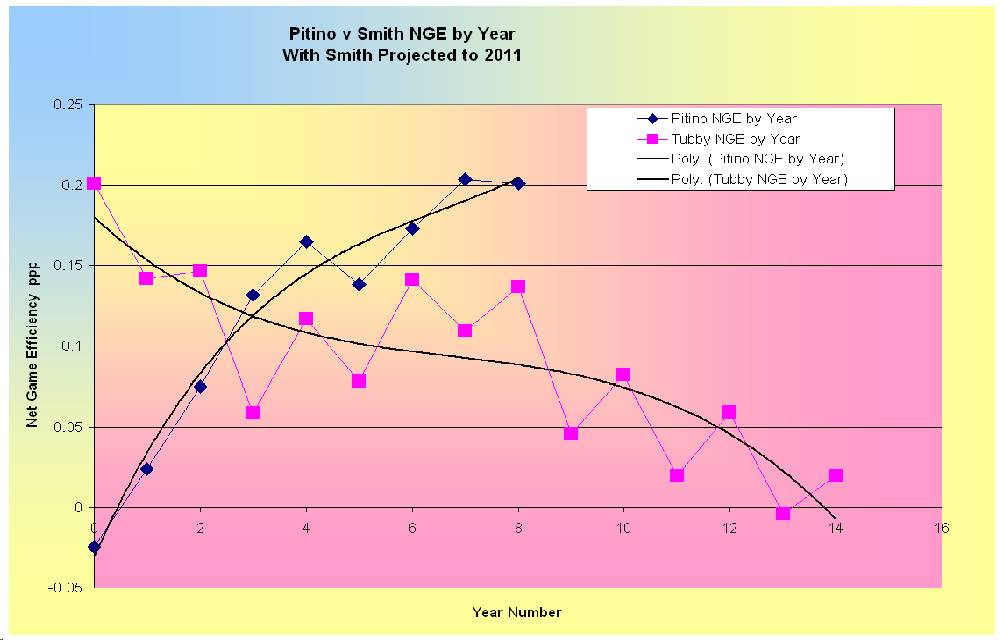
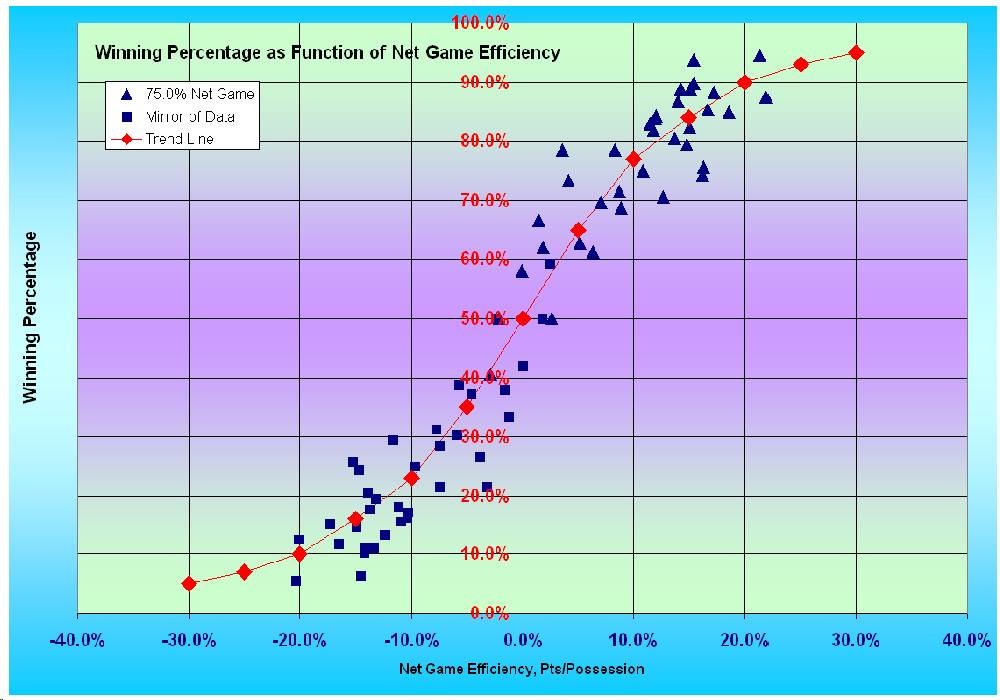
When NGE becomes negative, that team will have a losing record. The trends Tubby has established are there for all to see. Projecting his trends to the end of his contract does not bode well for the UK future, in 2009, a rebound from a slightly over .500 season to a season equivalent to last year, following in 2010 by the first ever, non-probation losing record since the arrival of Adolph Rupp. The following graph illustrates the relationship between the year end NGE and the year end winning percentage for all Kentucky seasons since 1972, Rupp's last. To balance the data, I have inverted each UK season with mirror data for the oppositions' average results.
Many insist that we should hope for a better future with Tubby. Fair enough, because we should never abandon our hope. Fans sustain themselves on perpetual hope. However, the trend has been established over 9 consecutive seasons, so why should we expect any thing different than for his historical trend to continue. It is time for Tubby Smith's performance, in 2006-07, demonstrate a reasonable basis for any future hope.
Just as there is hope that Tubby will defy his record, and return UK to elite status over the next two to three years, there is also despair that Tubby will fail, thereby sustaining the gradual overall rate of decline, and by this time next year, UK is facing many loses, and probably continued turmoil. Hope is wonderful. I believe in it, and practice it.
However, the odds are roughly 1/2 that the past trends will prevail, and 1/4 each that the next 4 years will be significantly better or worse than these trends. This means that the odds are about 3 in 4 that UK will decline further if Tubby remains, and the only issue is the rate of that decline.
Of course, that is why they play the games.
Submitted by Richard Cheeks
Copyright 2006
SugarHill Communications of Kentucky
All Rights Reserved