BIG BLUE FANS FOR
![]()
BASKETBALL
HISTORICAL DATA FOR ALL SEASONS
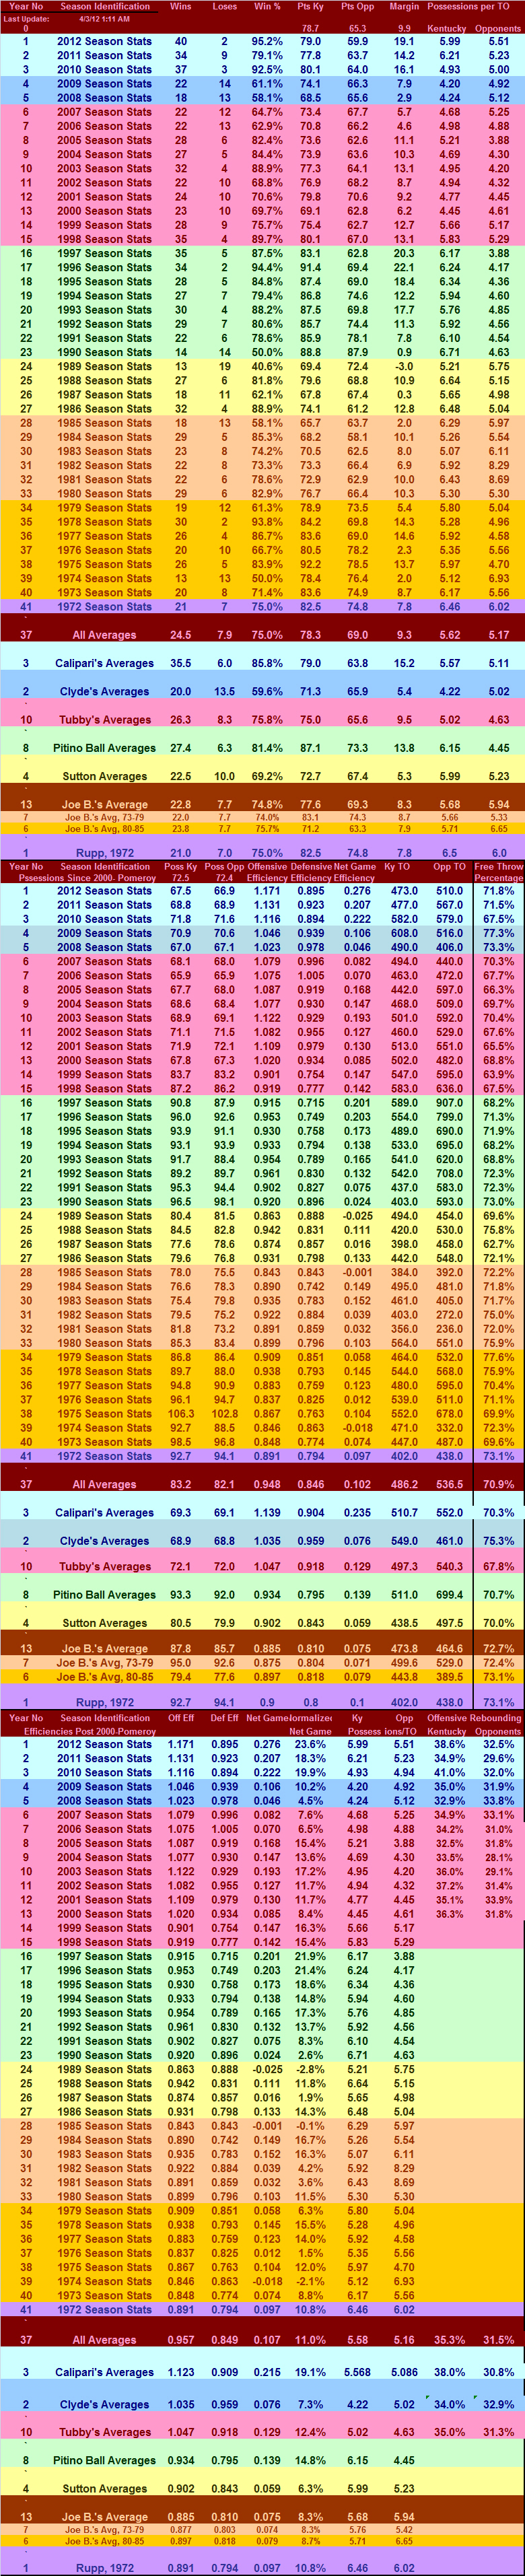
KENTUCKY BASKETBALL 1972 THROUGH 2011
TABULATED BY COACH
NOTE: These tabulations include all exhibition games when data for exhibition games are available
NOTE: As stated below, the game to game and season to season database includes data using two different definitions for a possession.
Those definitional difference create differences in the reported pace and efficiencies, as well as any other data presentations
that include pace [per possession] as a component. I have recast the data in the above Table for years since and including 2000
for which the UKAA maintains
offensive rebounding data for the seasons.
- All Games, Including Exhibitions
- All Games-D1 [No Exhibitions]
- Home
- Away
- Neutral Court
- Non-Conference
- SEC
- Pomeroy Top 50
- Pomeroy Over 50
- Post Season Play
- Games Since Louisville Game, 2003-2011
- SEC Tournament Gateway
- NCAA Tournament
1. Pace values will be lower, by the number of offensive rebounds.
2. Efficiencies will be higher due to the lower number of total possessions
3. Turnover rates will be higher due to the lower number of possessions.
CHECK OUT THESE OTHER ANALYTICAL WRITINGS
Change in Position on Definition of Possessions
Do Objective Performance Measures Like NGE
Account For Intangible?
Copyright 2006 - 2011
SugarHill Communications of Kentucky
All Rights Reserved