BIG BLUE FANS FOR
![]()
BASKETBALL

2012 NCAA TOURNAMENT-PROJECTED
BASED ON SEASON ENDING ADJUSTED NGE, SEEDINGS, AND
ALL ACTUAL GAME RESULTS AS THEY ARE PLAYED
(Note: Match ups for all games Automatically Change AsActual NCAA Tournament Results Change Future Tournament Match Ups)
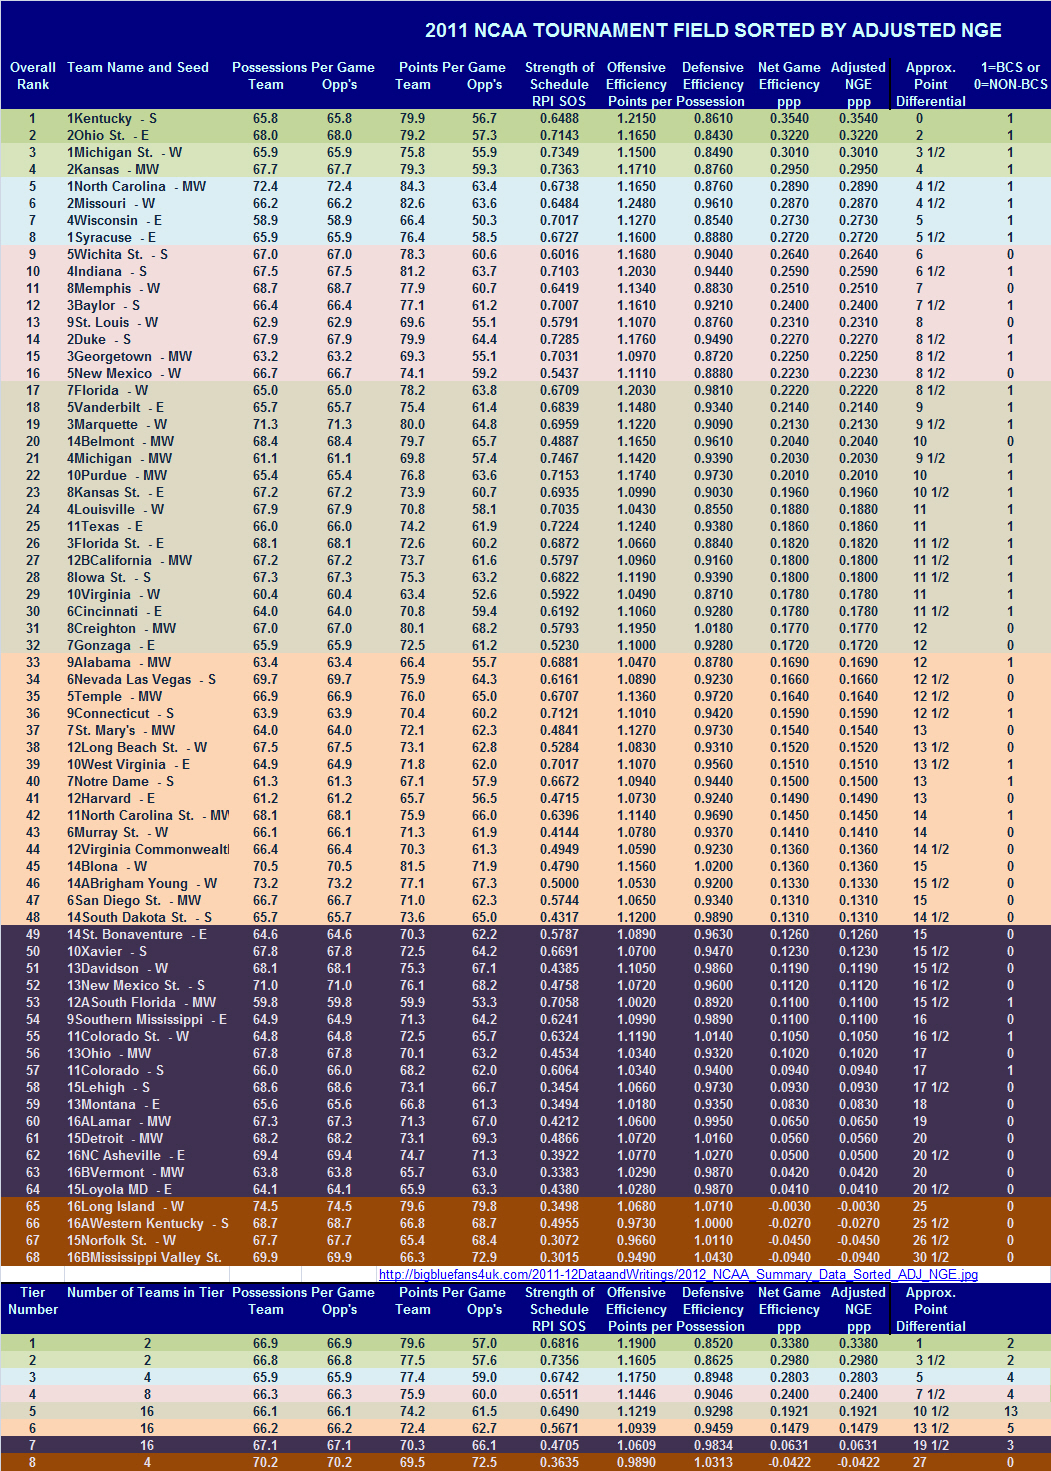
2012 NCAA TEAM DATA
AND NGE RANKING
ROUND OF 32
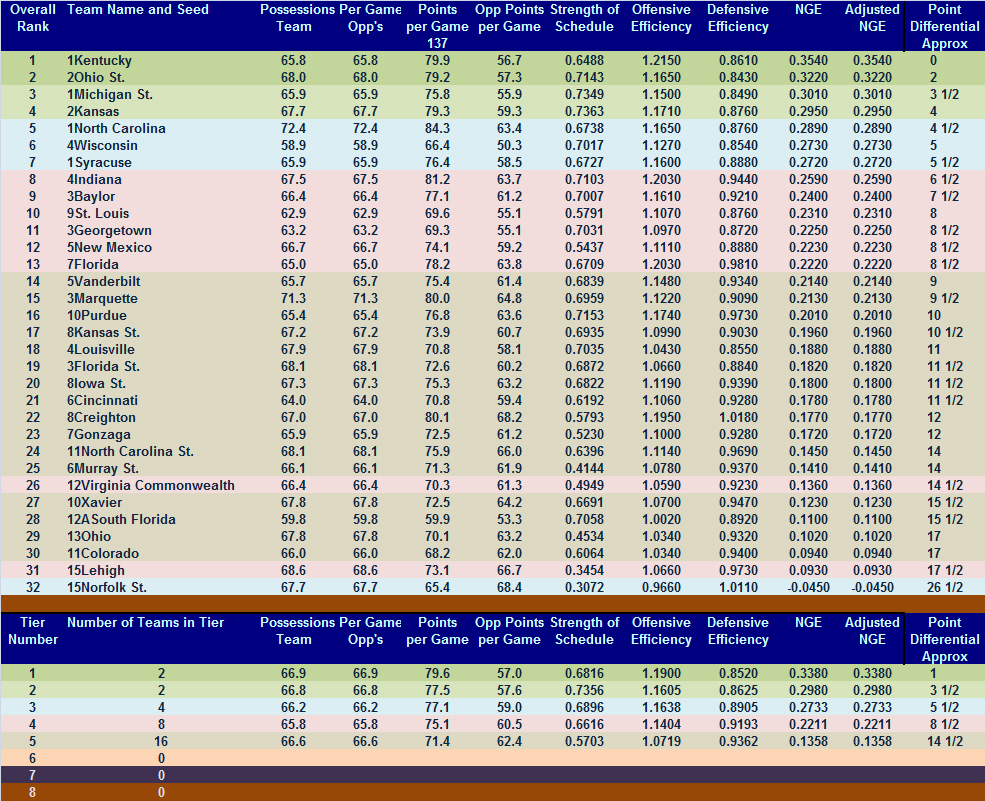
2012 NCAA TEAM DATA
AND NGE RANKING
SWEET 16
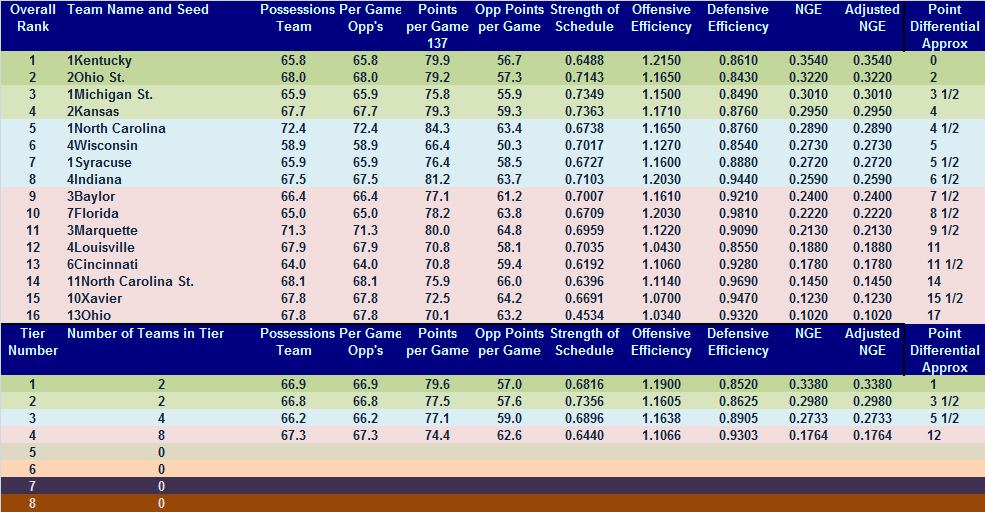
2012 NCAA TEAM DATA
AND NGE RANKING
ELITE 8
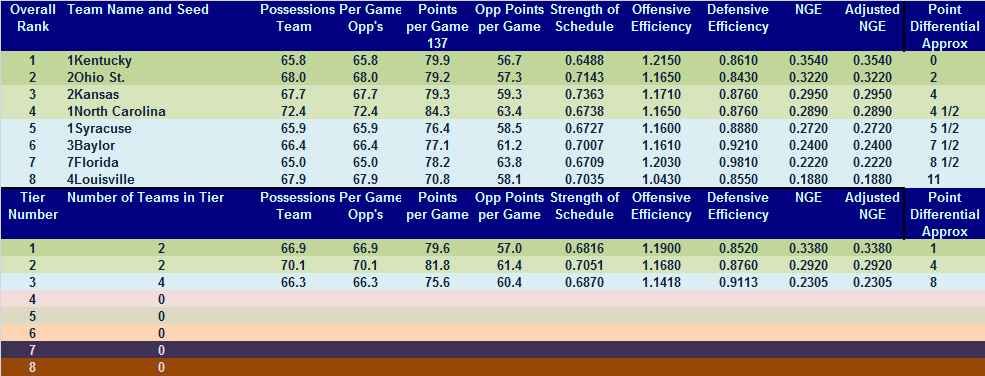
2012 NCAA TEAM DATA
AND NGE RANKING
FINAL 4
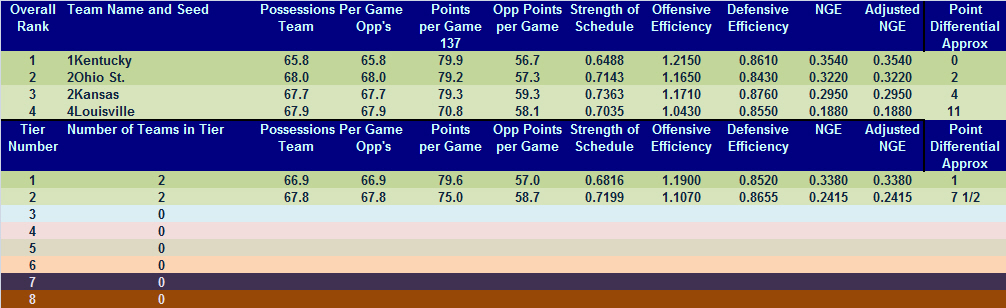
2012 NCAA TEAM DATA
AND NGE RANKING
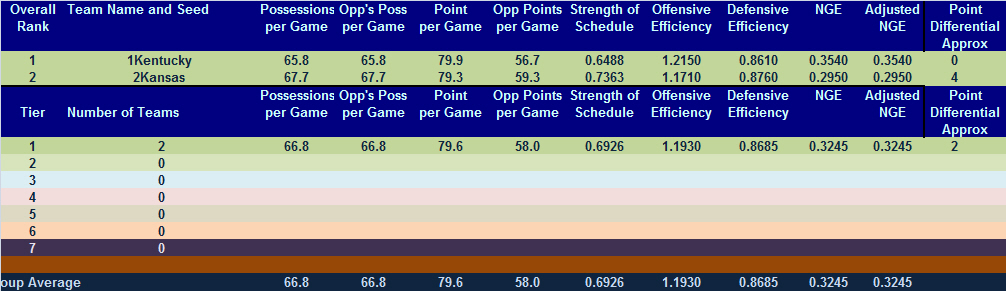
CHAMPIONSHIP GAME
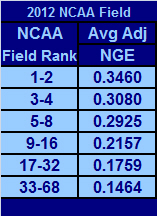
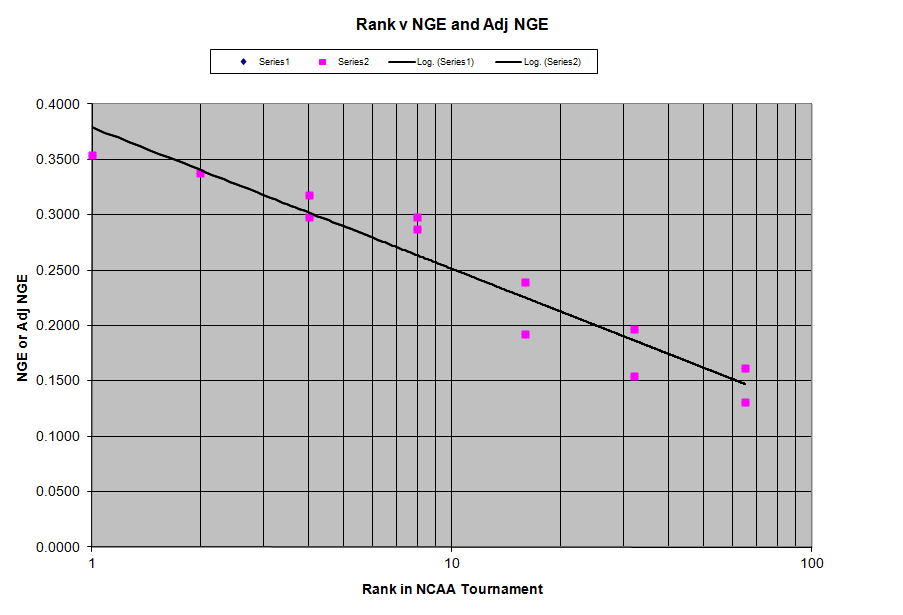
AVERAGE ADJUSTED NGE FOR EACH SEED POSITION FOR 2012
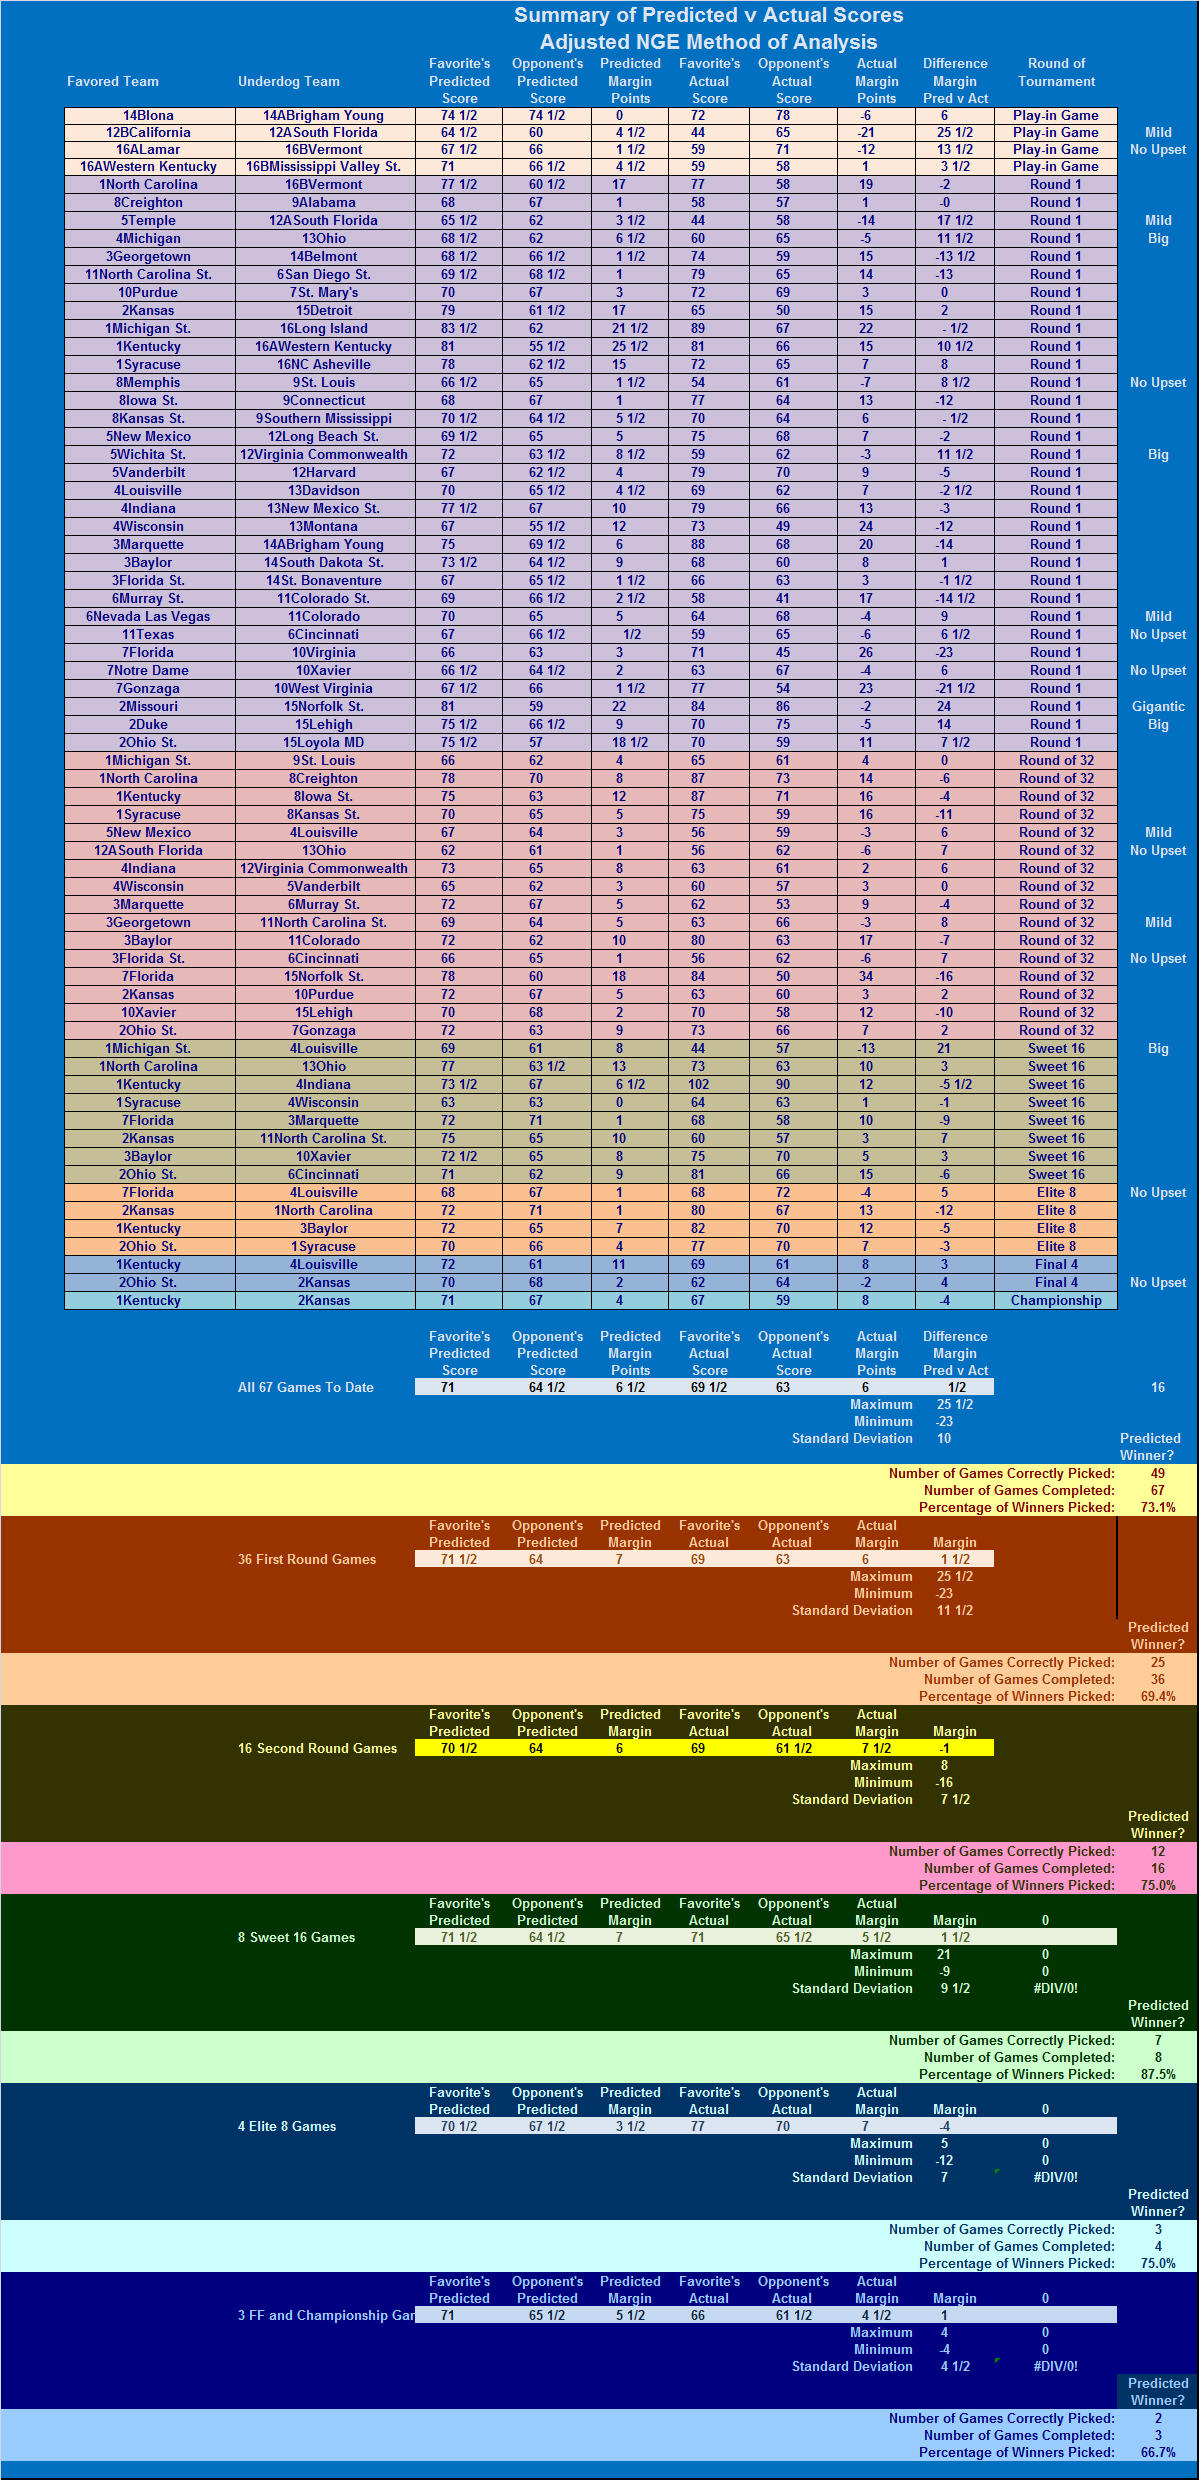
2011 SUMMARY OF PREDICTED V ACTUAL GAME BY GAME RESULTS
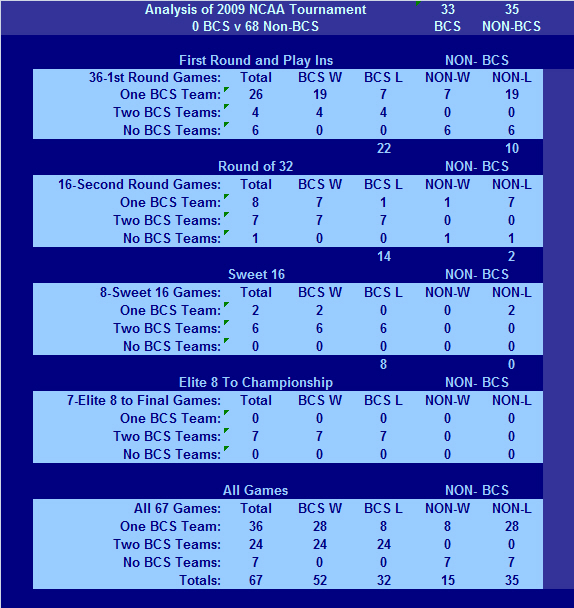
HOW HAVE THE NON-BCS TEAMS PERFORMED
AGAINST BCS TEAMS IN 2011?
SUMMARY OF UPSET FREQUENCIES AND TOURNAMENT UPSETS
SORTED BY PREDICTED MARGINS-2011
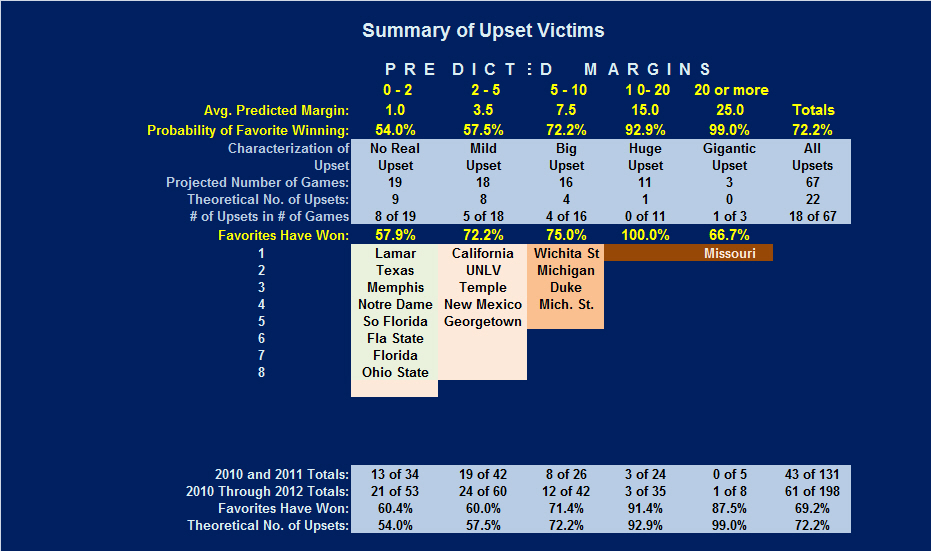
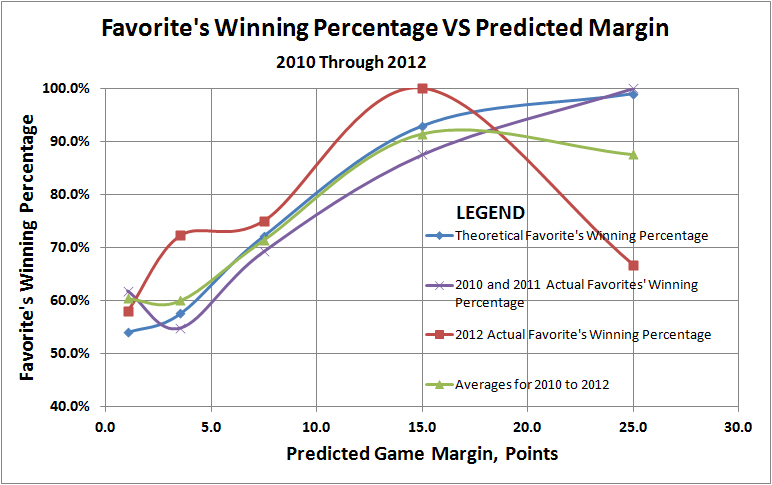
THEORETICAL V ACTUAL WINNING PERCENTAGE OF FAVORITES
AS A FUNCTION OF PREDICTED MARGIN-2011
![]()
To Data Tables for
Games Against Team Ranked RPI Top 50
The above data is presented in the next series of tables providing more detail in two respects. First, the tables examine more categories of statistics, and second, the data is sorted based on the following factors, in the order shown below:
You may link to any of these sorted data pages using the links above, or you can browse them in sequence using the "Continue" buttons at the bottom of each page.
1. Pace values will be lower, by the number of offensive rebounds.
2. Efficiencies will be higher due to the lower number of total possessions
3. Turnover rates will be higher due to the lower number of possessions.
CHECK OUT THESE OTHER ANALYTICAL WRITINGS
Change in Position on Definition of Possessions
Do Objective Performance Measures Like NGE
Account For Intangible?
Copyright 2011
SugarHill Communications of Kentucky
All Rights Reserved