BASKETBALL
BIG BLUE FANS FOR
![]()
BASKETBALL
![]()
ANALYSIS OF KENTUCKY BASKETBALL
WITH TEAM AVERAGES FROM 2000 THROUGH 2013
AND COMPARED TO 1996 CHAMPIONSHIP QUALITY
SEC TOURNAMENT-PROJECTED
BASED ON FINAL SEC STANDINGS
AND REGULAR SEASON NGE
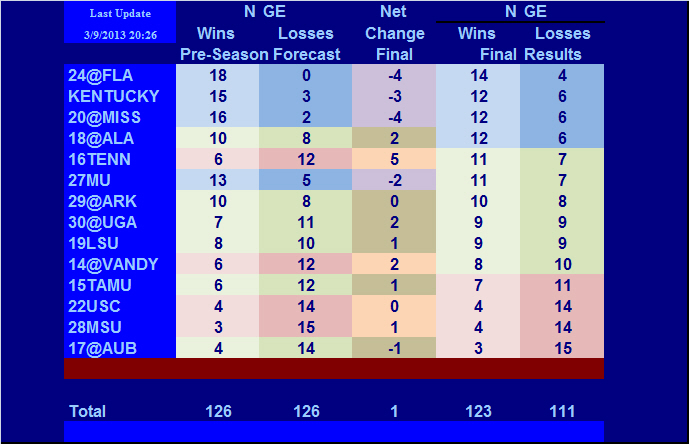
Projected SEC Final Standings Based On Actual Results Prior to SEC Season,
Based On SEC Projections For Games Based On NGE
Final SEC Standings
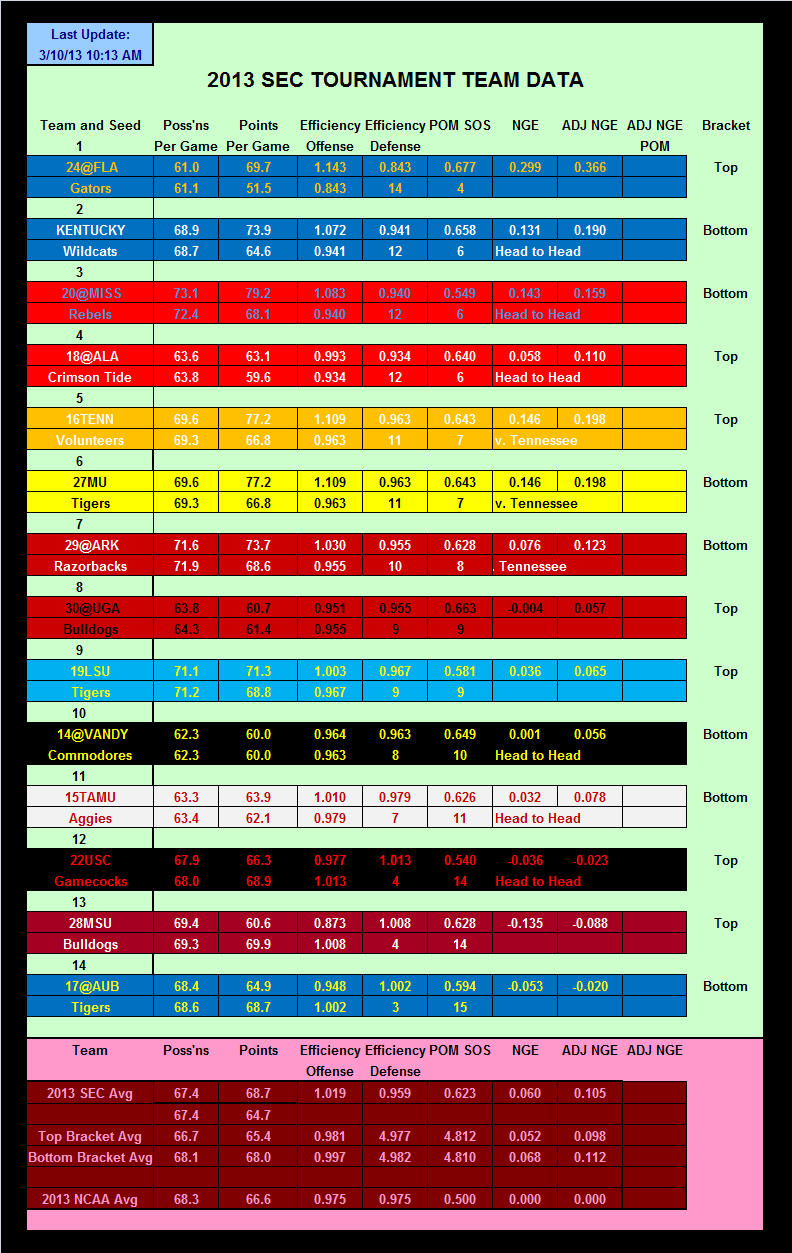
2013 SEC TEAM DATA
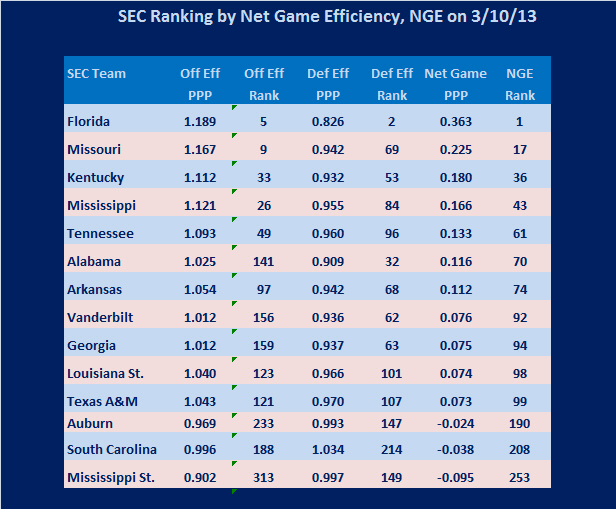
FOR TOURNAMENT SEEDING AND NGE ANALYSIS
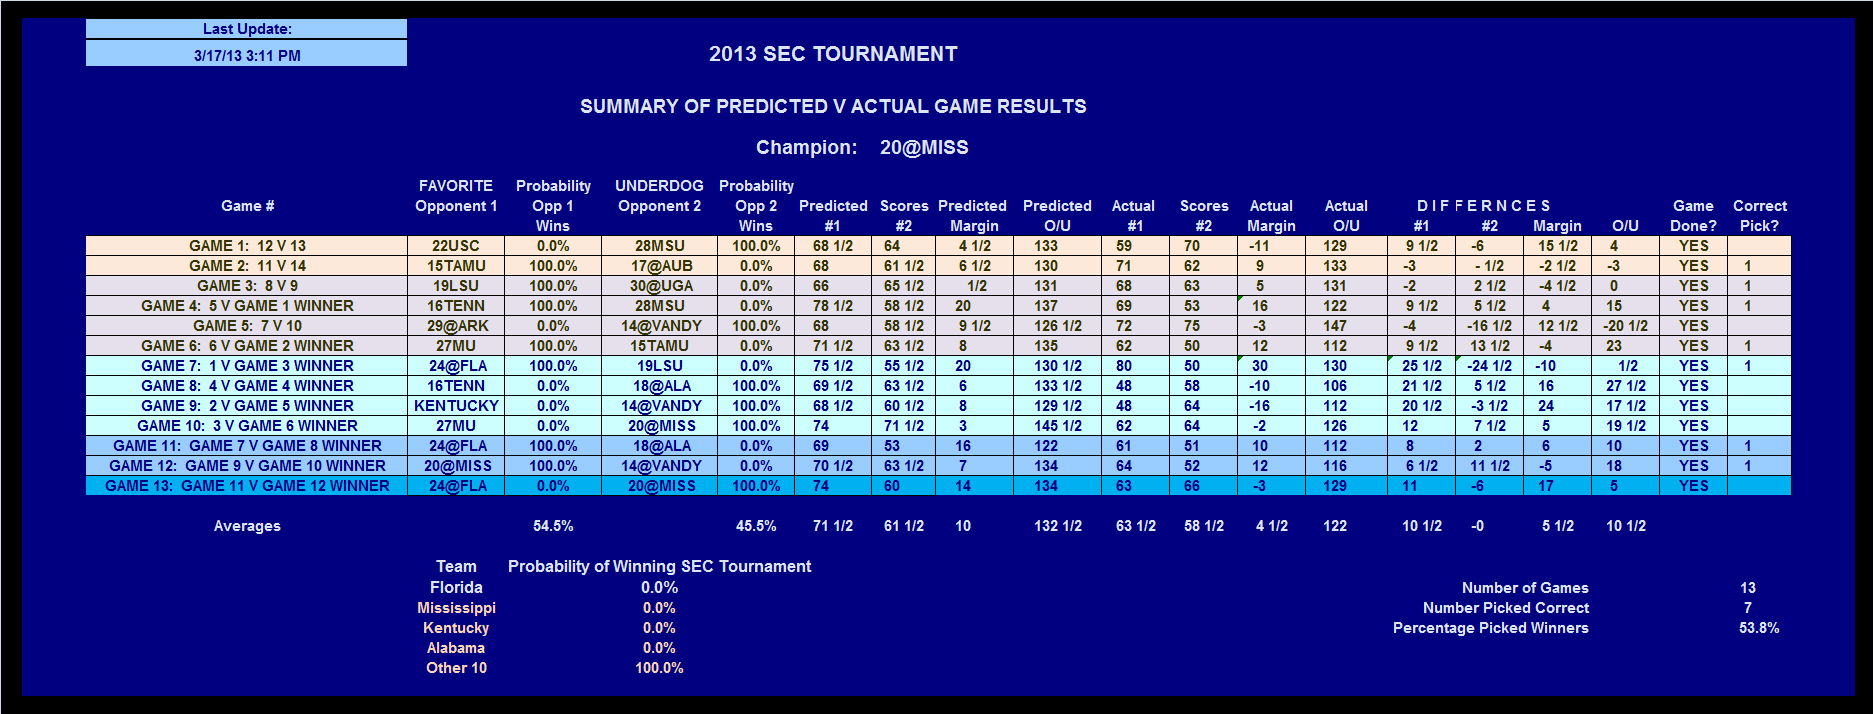
SUMMARY OF PREDICTED V ACTUAL GAME BY GAME RESULTS
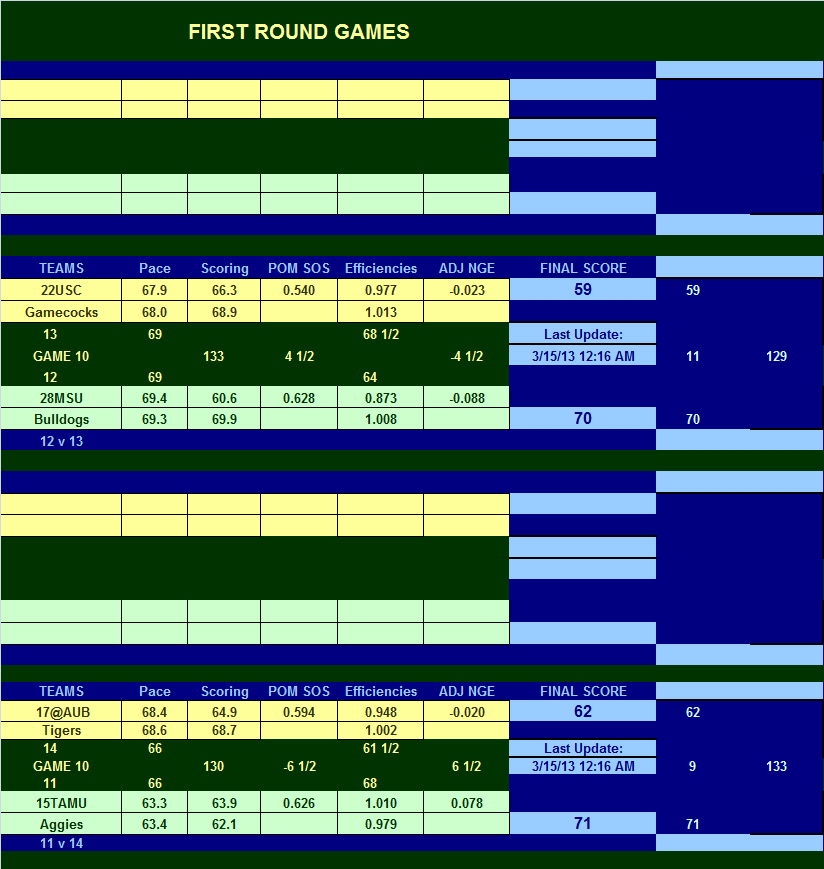
FIRST ROUND GAMES-PROJECTED
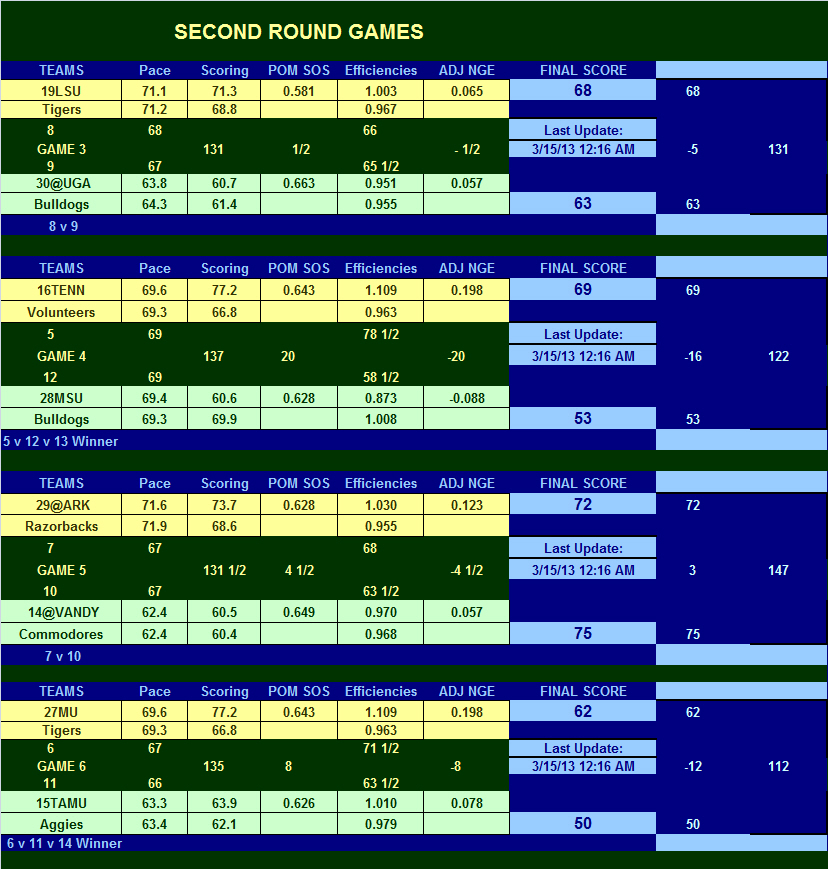
SECOND ROUND GAMES-PROJECTED
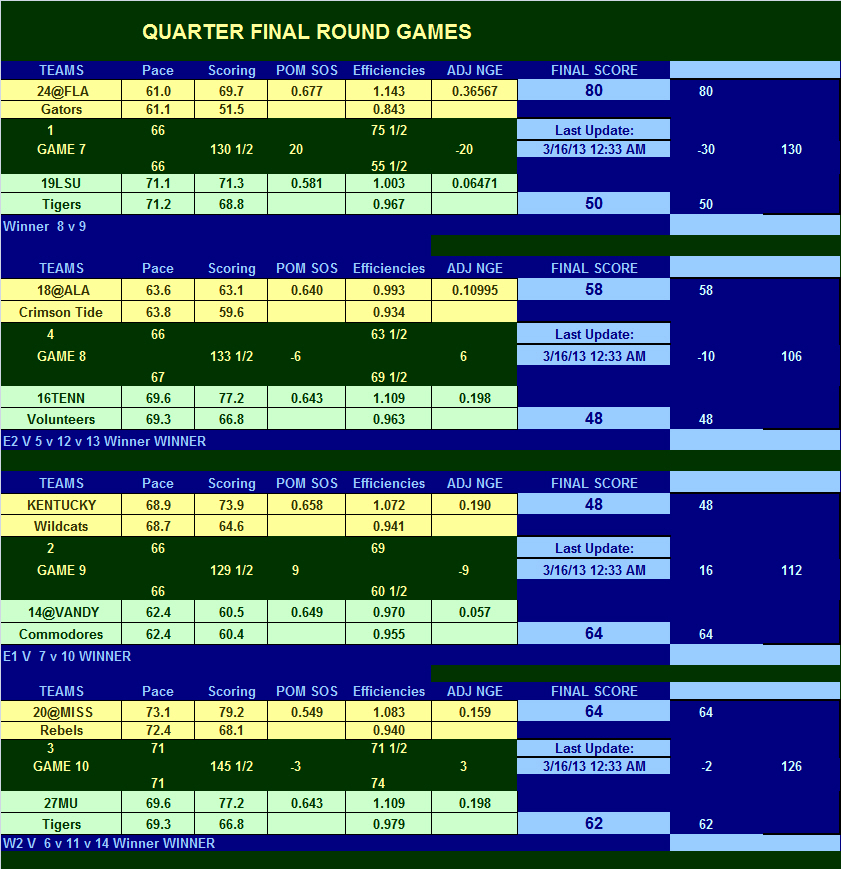
QUARTER FINAL GAMES-PROJECTED
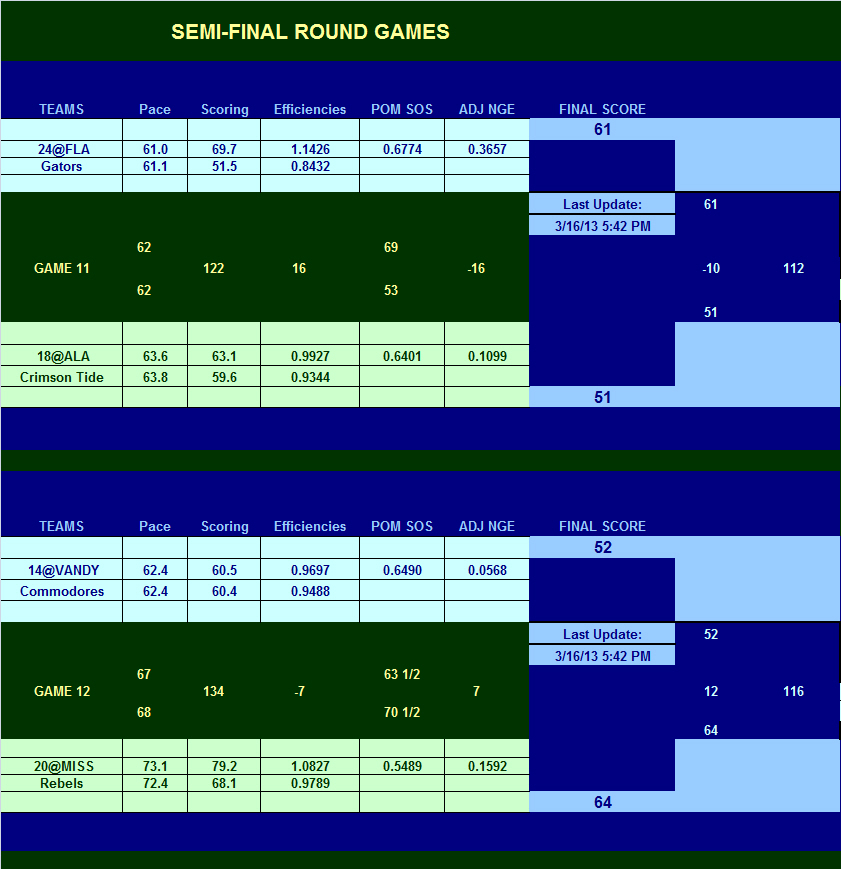
SEMI-FINAL GAMES-PROJECTED
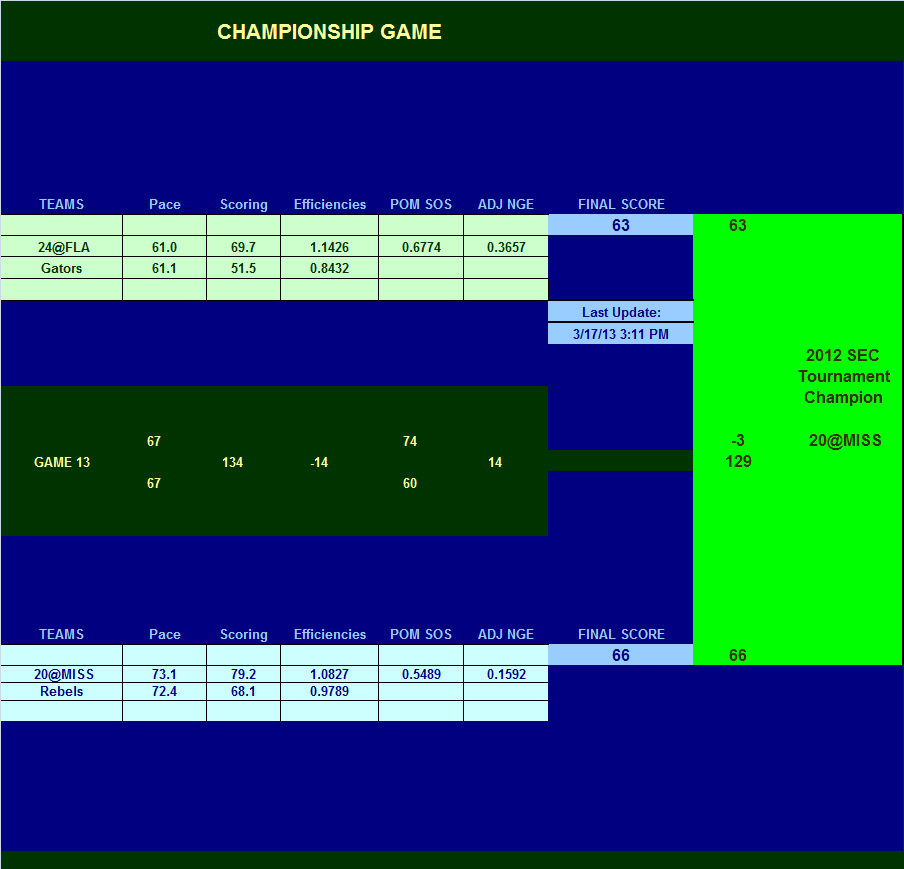
CHAMPIONSHIP GAME-PROJECTED
![]()
To Data Tables for Games Against Team Ranked Pomeroy Top 50
The above data is presented in the next series of tables providing more detail in two respects. First, the tables examine more categories of statistics, and second, the data is sorted based on the following factors, in the order shown below:
You may link to any of these sorted data pages using the links above, or you can browse them in sequence using the "Continue" buttons at the bottom of each page.
1. Pace values will be lower, by the number of offensive rebounds.
2. Efficiencies will be higher due to the lower number of total possessions
3. Turnover rates will be higher due to the lower number of possessions.
CHECK OUT THESE OTHER ANALYTICAL WRITINGS
Change in Position on Definition of Possessions
Do Objective Performance Measures Like NGE
Account For Intangible?
Copyright 2013
SugarHill Communications of Kentucky
All Rights Reserved