BIG BLUE FANS FOR
![]()
BASKETBALL
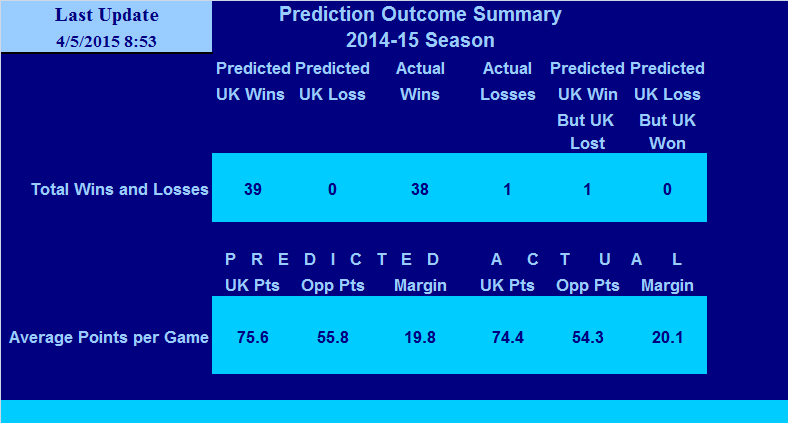
SUMMARY OF PREDICTED v ACTUAL SCORES
KENTUCKY BASKETBALL GAME
FROM 2004 TO PRESENT
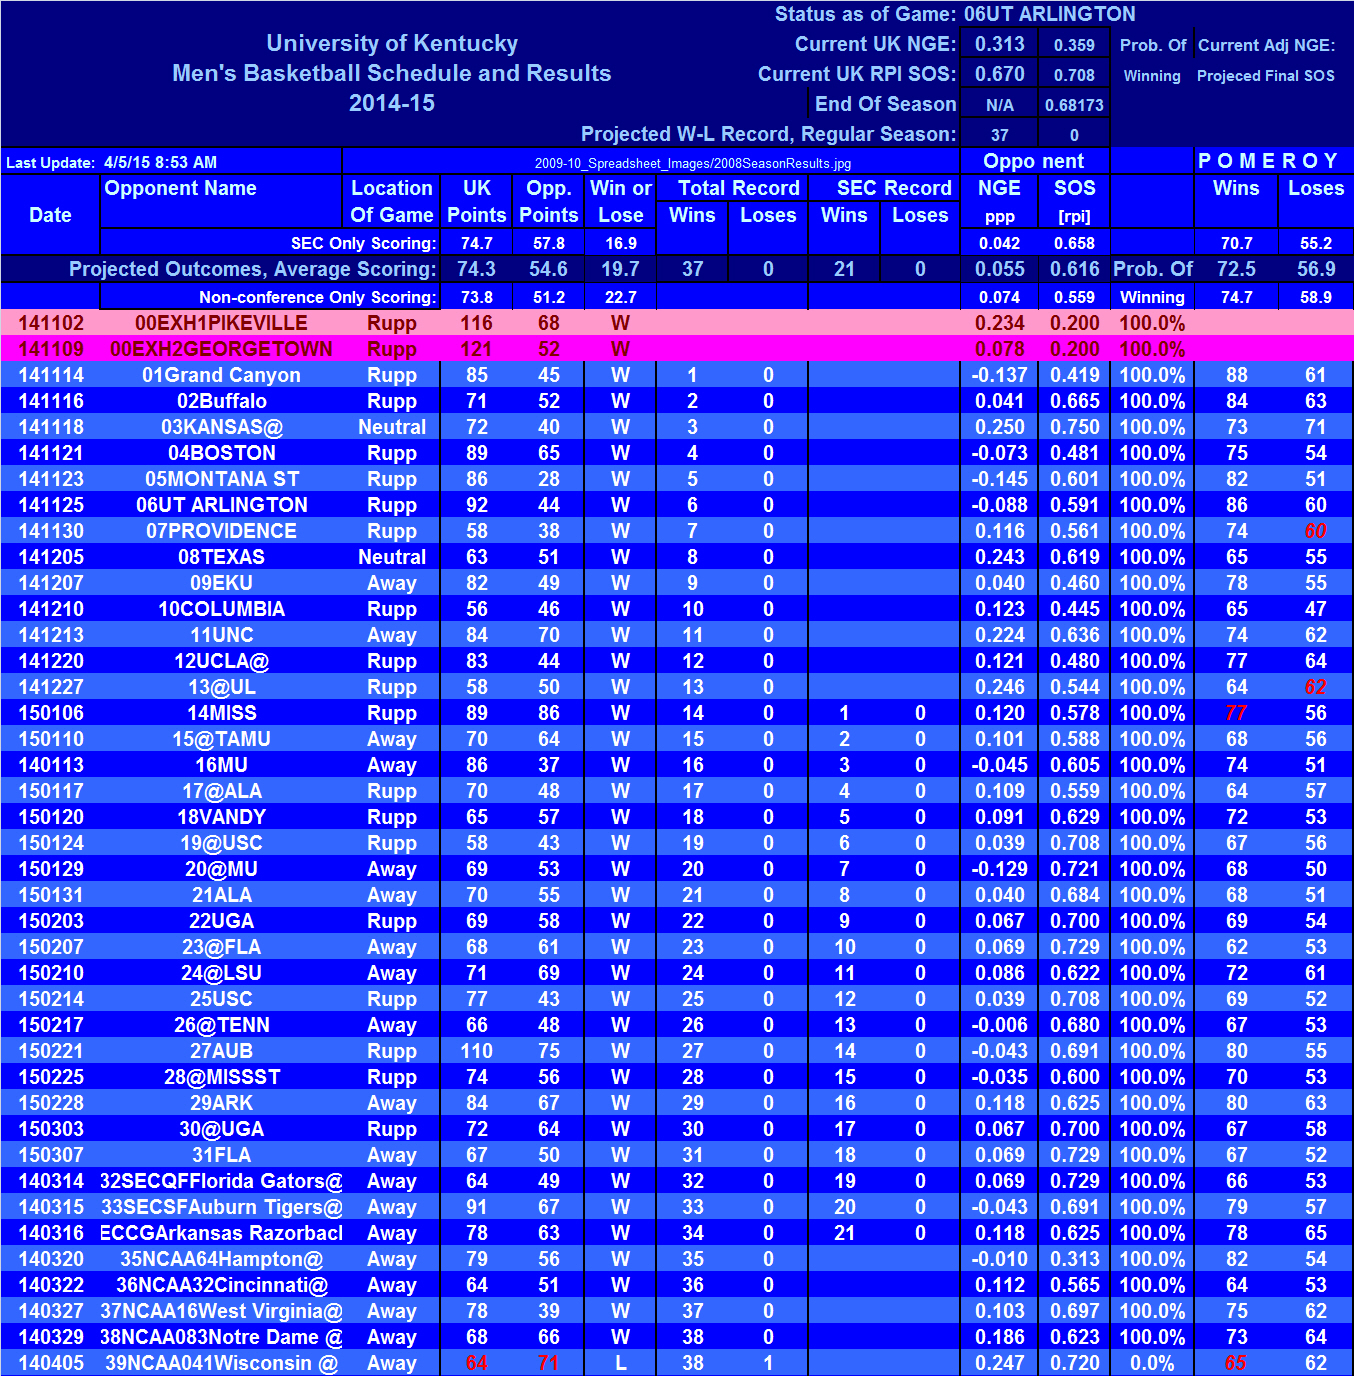
TABLE I
RESULTS TO DATE FOR 2013-14
NOTE: The Table Above Provides All Prediction v Actual Results
For the 2013-14 Season.
The Following Tables Provide All Predictions
beginning in November 2004 to Through the 2013 Seasons.
Prediction Methods are Evolving and
not all predictions
presented here are based on the same methodology.
Questions about the Methodology should be directed to
GoBigBlue@BigBlueFans4UK.com
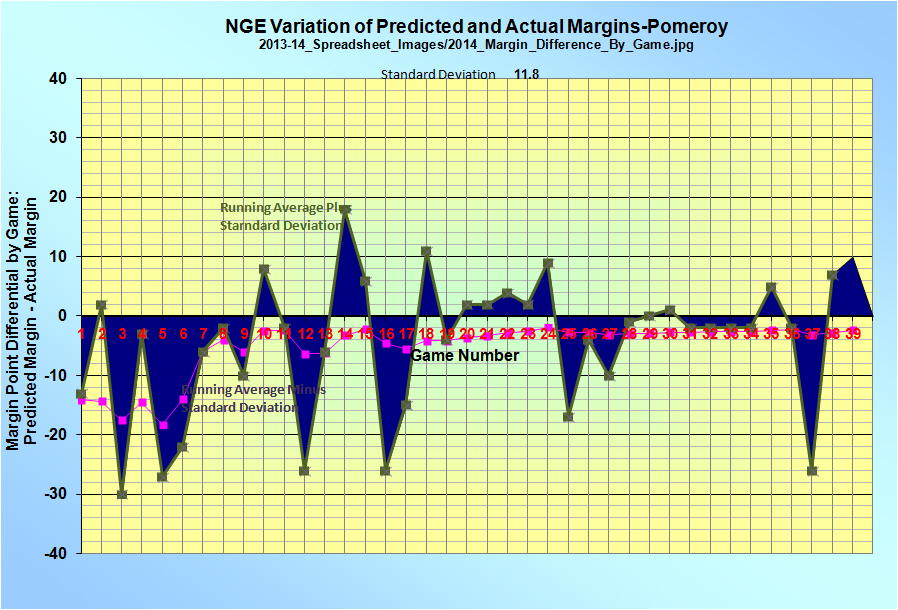
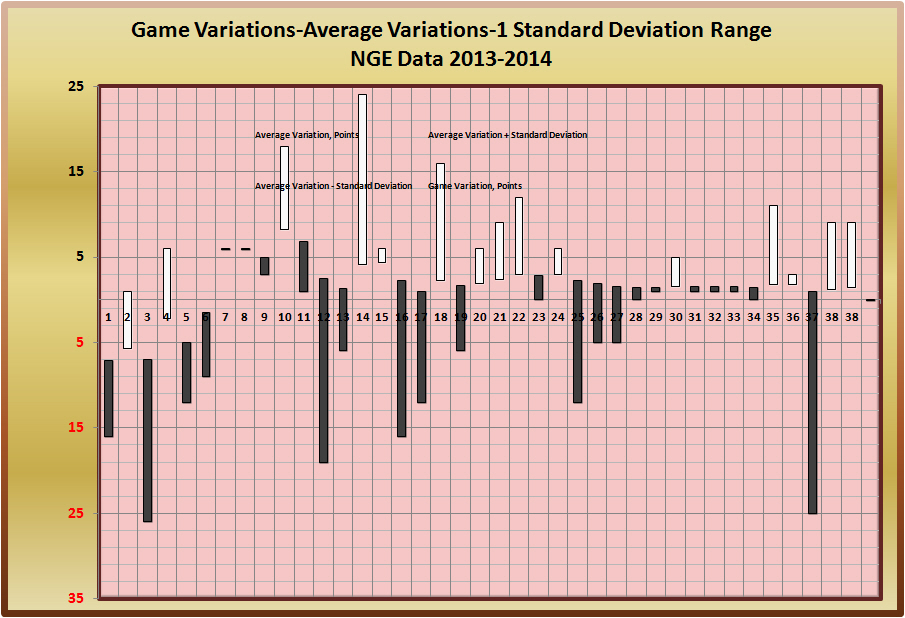
How Have the Predicted Game to Game Margins Compared
With Actual Game to Game Margins?
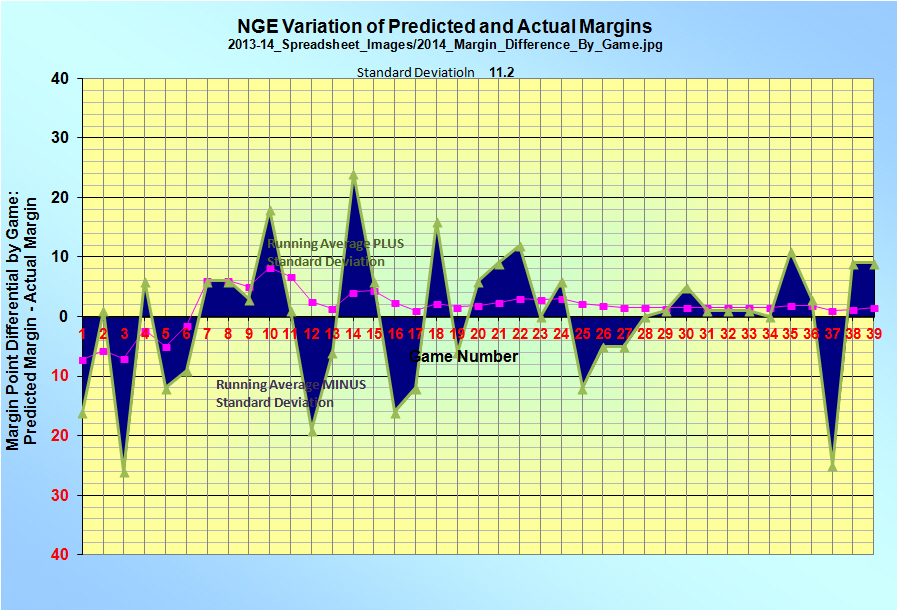
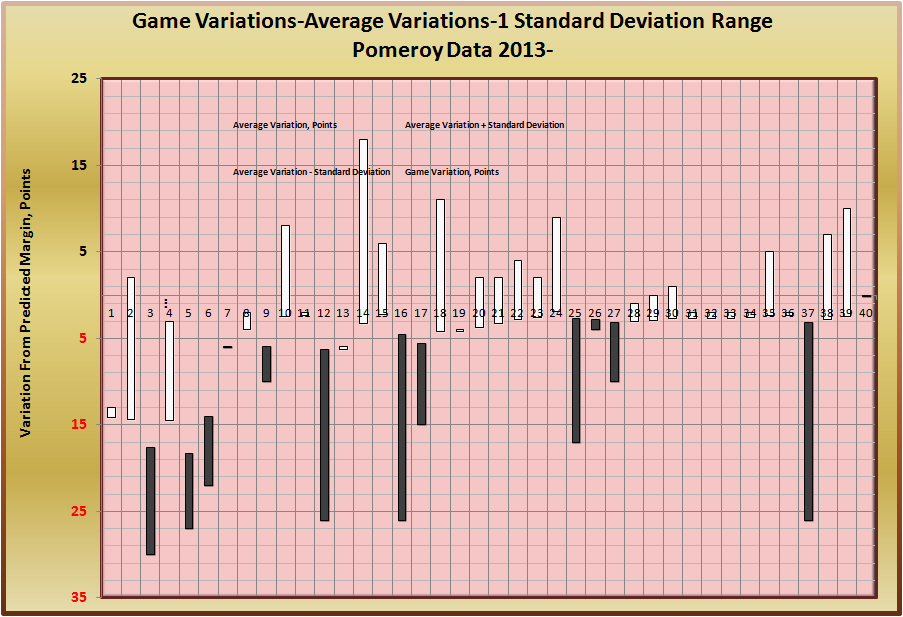
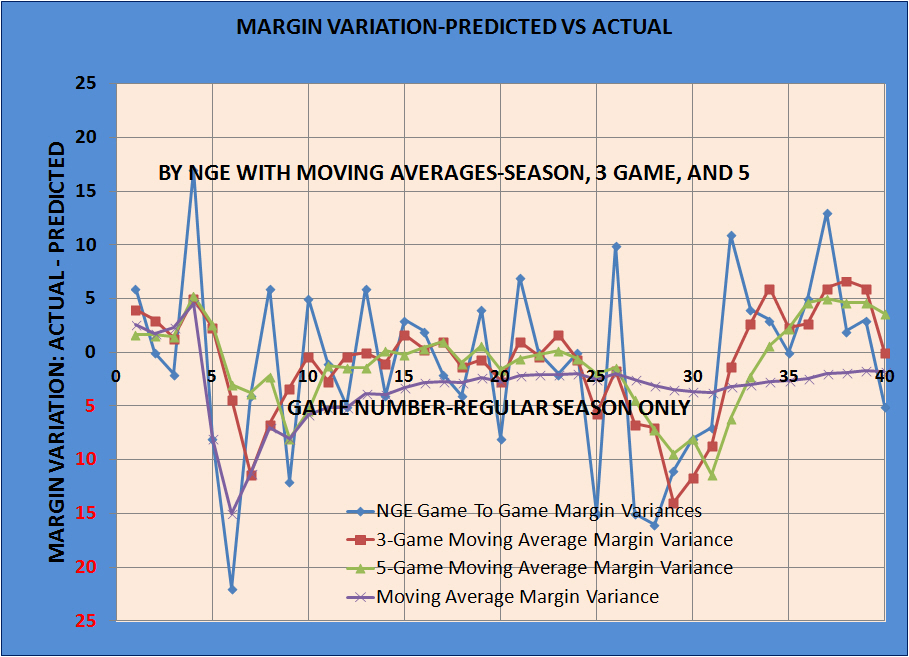
The above data is presented in the next series of tables providing more detail in two respects. First, the tables examine more categories of statistics, and second, the data is sorted based on the following factors, in the order shown below:
You may link to any of these sorted data pages using the links above, or you can browse them in sequence using the "Continue" buttons at the bottom of each page.
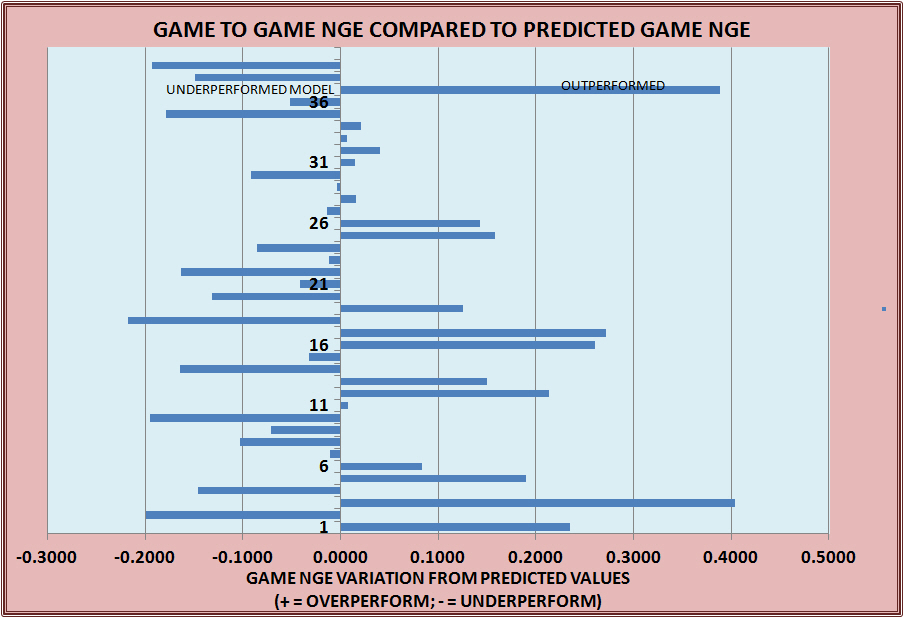
To a Summary Variances of Predicted and Actual Game Efficiencies
2010 through 20121. Pace values will be lower, by the number of offensive rebounds.
2. Efficiencies will be higher due to the lower number of total possessions
3. Turnover rates will be higher due to the lower number of possessions.
CHECK OUT THESE OTHER ANALYTICAL WRITINGS
Change in Position on Definition of Possessions
Do Objective Performance Measures Like NGE
Account For Intangible?
Copyright 2008-15
SugarHill Communications of Kentucky
All Rights Reserve
TABLE II
RESULTS FOR 2012-13 SEASON
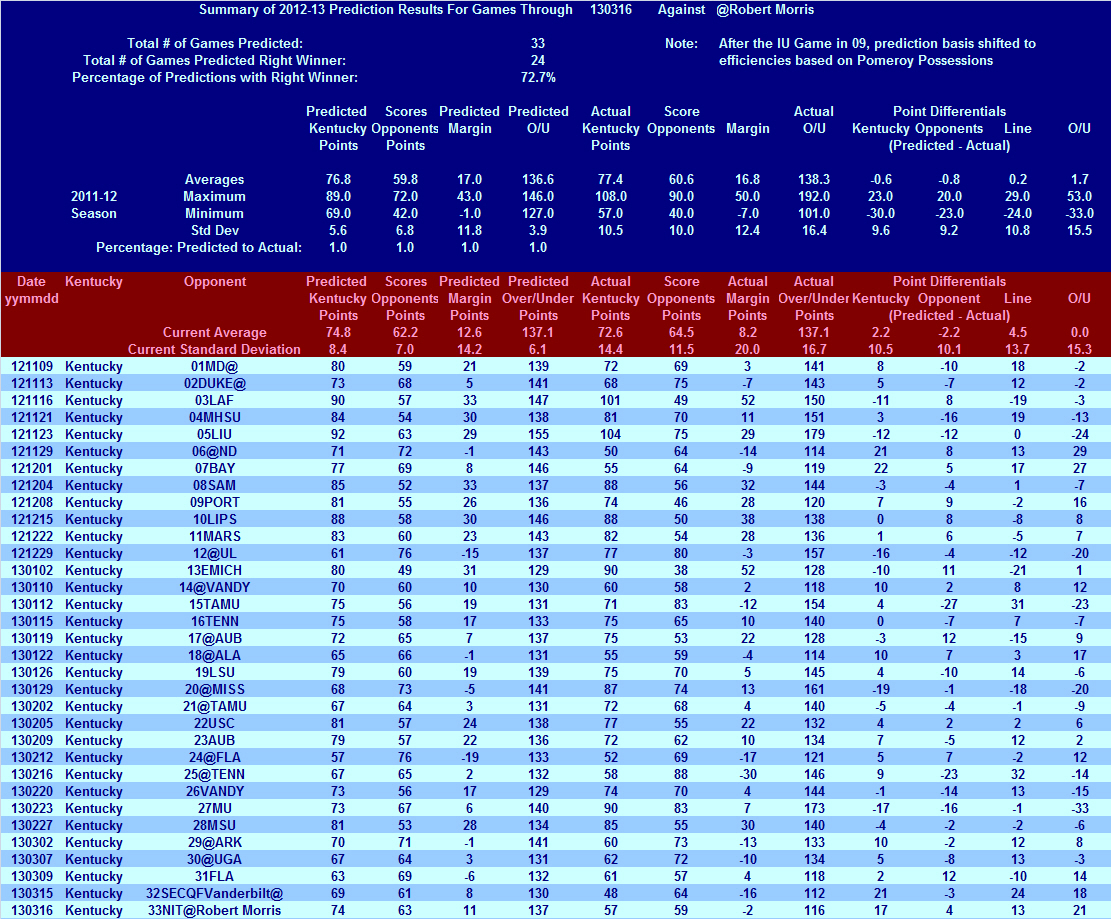
TABLE III
RESULTS FOR 2011-12 SEASON

TABLE IV
RESULTS TO DATE FOR 2010-11
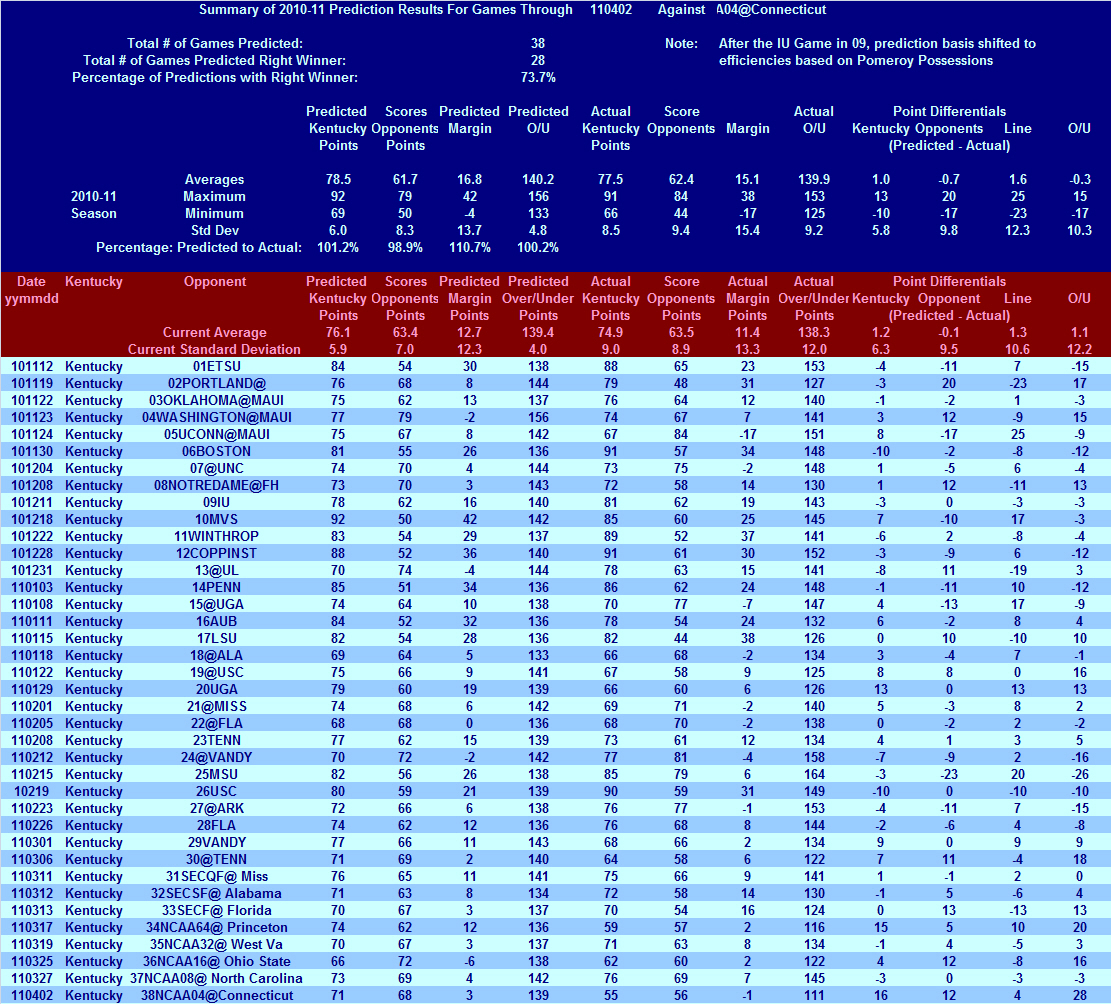
TABLE V
RESULTS TO DATE FOR 2009-10
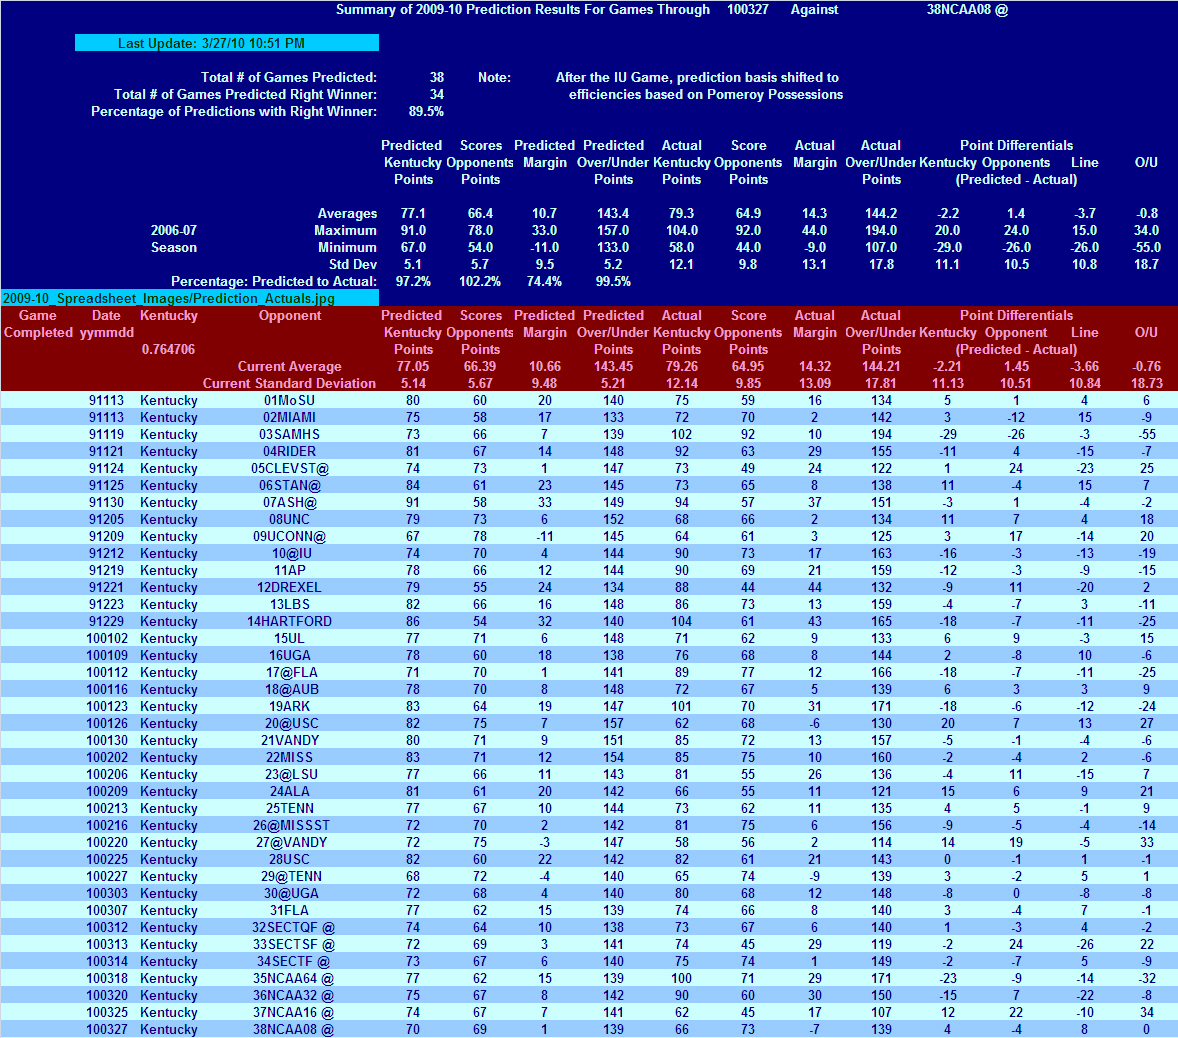
TABLE VI
RESULTS TO DATE FOR 2008-09
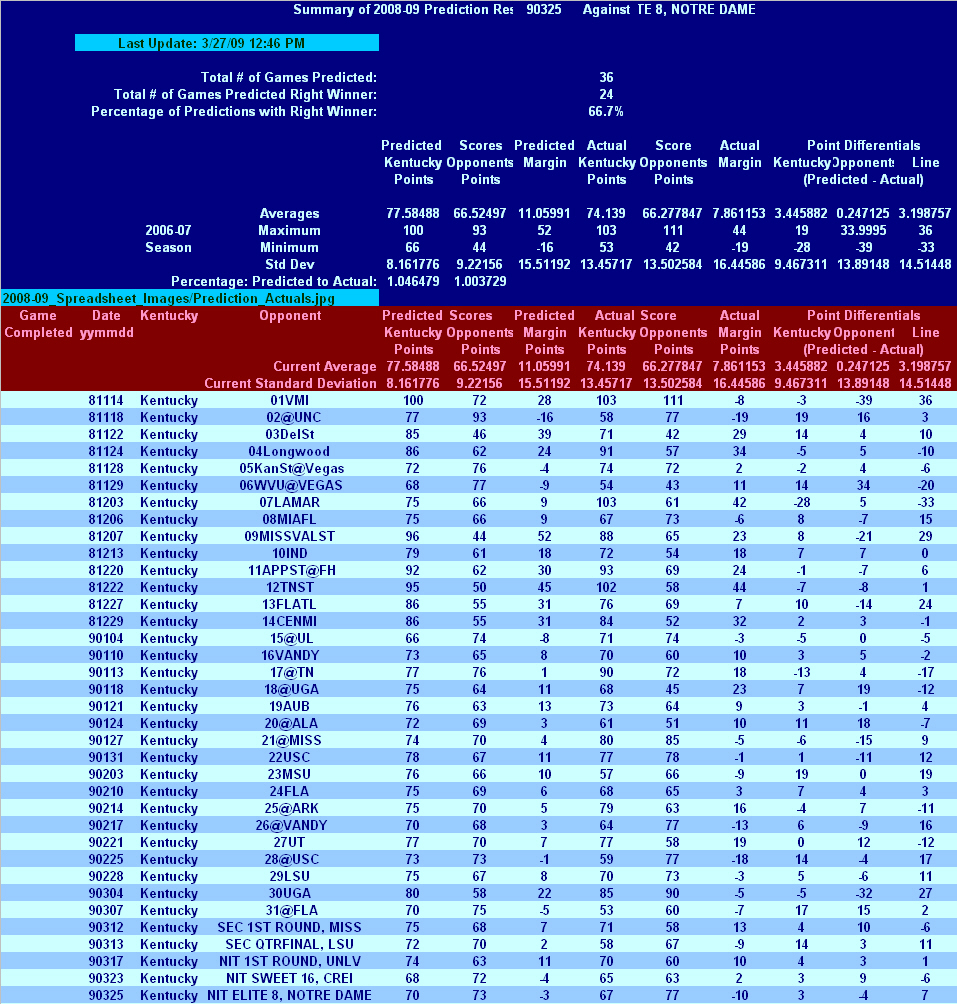
TABLE VII
RESULTS TO DATE FOR 2007-08
LAST UPDATE, MARCH 20, 2008
| Total # of Games Predicted: | 31 | ||||||||||
| Total # of Games Predicted Right Winner: | 22 | ||||||||||
| Percentage of Predictions with Right Winner: | 71.0% | ||||||||||
Predicted |
Scores |
Predicted |
Actual |
Score |
Actual |
Point Differentials |
|||||
Kentucky |
Opponents |
Margin |
Kentucky |
Opponents |
Margin |
Kentucky |
Opponents |
Line |
|||
Points |
Points |
Points |
Points |
(Predicted - Actual) |
|||||||
Averages |
73.0 |
65.5 |
7.6 |
68.5 |
65.6 |
2.9 |
4.5 |
-0.2 |
4.7 |
||
2006-07 |
Maximum |
87 |
78 |
47 |
92.001 |
93 |
48.001 |
25 |
27 |
40 |
|
Season |
Minimum |
65.0 |
40.0 |
-13.0 |
51.0 |
35.0 |
-41.0 |
-13.0 |
-28.0 |
-33.0 |
|
Std Dev |
6.1 |
9.1 |
14.5 |
9.1 |
14.5 |
17.7 |
9.8 |
13.5 |
16.1 |
||
Percentage: Predicted to Actual: |
1.1 |
1.0 |
|||||||||
Date |
Kentucky |
Opponent |
Predicted |
Scores |
Predicted |
Actual |
Score |
Actual |
Point Differentials |
9.0 |
|
yymmdd |
Kentucky |
Opponents |
Margin |
Kentucky |
Opponents |
Margin |
Kentucky |
Opponent |
Line |
||
0.764706 |
Points |
Points |
Points |
Points |
(Predicted - Actual) |
||||||
Current Average |
73.0 |
65.5 |
7.6 |
68.5 |
65.6 |
2.9 |
4.5 |
-0.2 |
4.7 |
||
Current Standard Deviation |
6.123637 |
9.076852 |
14.48395 |
9.12465 |
14.541164 |
17.72834 |
9.814591 |
13.53538 |
16.13165 |
||
71106 |
Kentucky |
2kSports Central Arkansas |
83 |
54 |
29 |
67 |
40 |
27 |
16 |
14 |
2 |
71107 |
Kentucky |
2kSports Gardner Webb |
81 |
57 |
24 |
68 |
84 |
-16 |
13 |
-27 |
40 |
71121 |
Kentucky |
Liberty |
80 |
46 |
34 |
80 |
54 |
26 |
0 |
-8 |
8 |
71124 |
Kentucky |
Texas Southern |
77 |
62 |
15 |
83 |
35 |
48 |
-6 |
27 |
-33 |
71127 |
Kentucky |
Stony Brook |
87 |
40 |
47 |
62 |
52 |
10 |
25 |
-12 |
37 |
71201 |
Kentucky |
UNC |
71 |
69 |
2 |
77 |
86 |
-9 |
-6 |
-17 |
11 |
71208 |
Kentucky |
@Indiana |
67 |
74 |
-7 |
51 |
70 |
-19 |
16 |
4 |
12 |
71215 |
Kentucky |
UAB @FreedomHall |
69 |
64 |
5 |
76 |
79 |
-3 |
-7 |
-15 |
8 |
71218 |
Kentucky |
@Houston |
67 |
70 |
-3 |
69 |
83 |
-14 |
-2 |
-13 |
11 |
71222 |
Kentucky |
Tennessee Tech |
87 |
54 |
33 |
69 |
47 |
22 |
18 |
7 |
11 |
71229 |
Kentucky |
San Diego |
76 |
53 |
23 |
72 |
81 |
-9 |
4 |
-28 |
32 |
71231 |
Kentucky |
Florida International |
79 |
58 |
21 |
92 |
49 |
43 |
-13 |
9 |
-22 |
80105 |
Kentucky |
Louisville |
68 |
65 |
3 |
75 |
89 |
-14 |
-7 |
-24 |
17 |
80112 |
Kentucky |
Vanderbilt |
76 |
75 |
1 |
79 |
73 |
6 |
-3 |
2 |
-5 |
80115 |
Kentucky |
@Mississippi State |
65 |
72 |
-7 |
64 |
69 |
-5 |
1 |
3 |
-2 |
80119 |
Kentucky |
@Florida |
66 |
76 |
-10 |
70 |
81 |
-11 |
-4 |
-5 |
1 |
80122 |
Kentucky |
Tennessee |
70 |
77 |
-7 |
72 |
66 |
6 |
-2 |
11 |
-13 |
80126 |
Kentucky |
USC |
73 |
69 |
4 |
78 |
70 |
8 |
-5 |
-1 |
-4 |
80202 |
Kentucky |
@Georgia |
69 |
68 |
1 |
63 |
58 |
5 |
6 |
10 |
-4 |
80206 |
Kentucky |
@Auburn |
73 |
67 |
6 |
66 |
63 |
3 |
7 |
4 |
3 |
80209 |
Kentucky |
Alabama |
78 |
66 |
12 |
62 |
52 |
10 |
16 |
14 |
2 |
80212 |
Kentucky |
@Vanderbilt |
71 |
76 |
-5 |
52 |
93 |
-41 |
19 |
-17 |
36 |
80216 |
Kentucky |
@LSU |
68 |
69 |
-1 |
67 |
63 |
4 |
1 |
6 |
-5 |
80219 |
Kentucky |
Georgia |
73 |
62 |
11 |
61 |
55 |
6 |
12 |
7 |
5 |
80223 |
Kentucky |
Arkansas |
72 |
66 |
6 |
63 |
58 |
5 |
9 |
8 |
1 |
80227 |
Kentucky |
Mississippi |
74 |
69 |
5 |
58 |
54 |
4 |
16 |
15 |
1 |
80302 |
Kentucky |
@Tennessee |
65 |
78 |
-13 |
60 |
63 |
-3 |
5 |
15 |
-10 |
80305 |
Kentucky |
@USC |
68 |
71 |
-3 |
71 |
63 |
8 |
-3 |
8 |
-11 |
80309 |
Kentucky |
Florida |
73 |
68 |
5 |
75 |
70 |
5 |
-2 |
-2 |
0 |
80314 |
Kentucky |
SEC Georgia |
72 |
63 |
9 |
56 |
60 |
-4 |
16 |
3 |
13 |
80315 |
Kentucky |
SEC |
66 |
71 |
-5 |
66 |
74 |
-8 |
0 |
-3 |
3 |
TABLE VIII
RESULTS TO DATE FOR 2006-07
LAST UPDATE, MARCH 18, 2007
| Summary of 2006-07 Prediction Results For Games Through | 70318 | Against | NCAA KANSAS | ||||||||
| Total # of Games Predicted: | 34 | ||||||||||
| Total # of Games Predicted Right Winner: | 28 | ||||||||||
| Percentage of Predictions with Right Winner: | 82.4% | ||||||||||
| Predicted | Scores | Predicted | Actual | Score | Actual | Point Differentials | |||||
| Kentucky | Opponents | Margin | Kentucky | Opponents | Margin | Kentucky | Opponents | Line | |||
| Points | Points | Points | Points | (Predicted - Actual) | |||||||
| Averages | 72.8 | 65.6 | 7.1 | 73.4 | 67.7 | 5.7 | -0.6 | -2.1 | 1.4 | ||
| 2006-07 | Maximum | 83 | 84 | 31 | 95 | 89 | 38 | 13 | 26 | 23 | |
| Season | Minimum | 61 | 46 | -20 | 57 | 46 | -17 | -25 | -34 | -27 | |
| Std Dev | 5.3 | 8.5 | 12.2 | 9.6 | 11.8 | 12.4 | 9.3 | 12.3 | 10.2 | ||
| Percentage: Predicted to Actual: | 99.1% | 96.9% | |||||||||
| Date | Kentucky | Opponent | Predicted | Scores | Predicted | Actual | Score | Actual | Point Differentials | ||
| yymmdd | Kentucky | Opponents | Margin | Kentucky | Opponents | Margin | Kentucky | Opponent | Line | ||
| Points | Points | Points | Points | (Predicted - Actual) | |||||||
| Current Average | 72.8 | 65.6 | 7.1 | 73.4 | 67.7 | 5.7 | (0.6) | (2.1) | 1.4 | ||
| Current Standard Deviation | 5.3 | 8.5 | 12.2 | 9.6 | 11.8 | 12.4 | 9.3 | 12.3 | 10.2 | ||
| 61115 | Kentucky | Miami_Ohio | 69 | 60 | 9 | 57 | 46 | 11 | 12 | 14 | (2) |
| 61117 | Kentucky | MissValleyState | 77 | 46 | 31 | 79 | 56 | 23 | (2) | (10) | 8 |
| 61120 | Kentucky | DePaul @ Maui | 62 | 53 | 9 | 87 | 81 | 6 | (25) | (28) | 3 |
| 61121 | Kentucky | UCLA @ Maui | 61 | 81 | (20) | 68 | 73 | (5) | (7) | 8 | (15) |
| 61122 | Kentucky | Memphis @ Maui | 70 | 81 | (11) | 63 | 80 | (17) | 7 | 1 | 6 |
| 61128 | Kentucky | CollegeofCharleston | 77 | 62 | 15 | 77 | 61 | 16 | 0 | 1 | (1) |
| 61202 | Kentucky | @ UNC | 69 | 84 | (15) | 63 | 75 | (12) | 6 | 9 | (3) |
| 61205 | Kentucky | Chattanooga @ Louisville | 75 | 59 | 16 | 79 | 63 | 16 | (4) | (4) | 0 |
| 61209 | Kentucky | Indiana | 67 | 69 | (2) | 59 | 54 | 5 | 8 | 15 | (7) |
| 61216 | Kentucky | @ Louisville | 67 | 75 | (8) | 61 | 49 | 12 | 6 | 26 | (20) |
| 61219 | Kentucky | Santa Clara | 75 | 57 | 18 | 74 | 60 | 14 | 1 | (3) | 4 |
| 61222 | Kentucky | Massachusetts | 77 | 59 | 18 | 82 | 68 | 14 | (5) | (9) | 4 |
| 61229 | Kentucky | Eastern Kentucky | 80 | 53 | 27 | 78 | 65 | 13 | 2 | (12) | 14 |
| 70103 | Kentucky | Houston | 83 | 62 | 21 | 77 | 70 | 7 | 6 | (8) | 14 |
| 70106 | Kentucky | @ Ole Miss | 74 | 65 | 9 | 68 | 58 | 10 | 6 | 7 | (1) |
| 70110 | Kentucky | Auburn | 79 | 59 | 20 | 84 | 57 | 27 | (5) | 2 | (7) |
| 70113 | Kentucky | Mississippi State | 76 | 63 | 13 | 64 | 60 | 4 | 12 | 3 | 9 |
| 70116 | Kentucky | @ South Carolina | 71 | 60 | 11 | 87 | 49 | 38 | (16) | 11 | (27) |
| 70120 | Kentucky | Vanderbilt | 80 | 62 | 18 | 67 | 72 | (5) | 13 | (10) | 23 |
| 70124 | Kentucky | @ Georgia | 70 | 71 | (1) | 69 | 78 | (9) | 1 | (7) | 8 |
| 70128 | Kentucky | Tennessee | 81 | 66 | 15 | 76 | 57 | 19 | 5 | 9 | (4) |
| 70203 | Kentucky | @ Arkansas | 67 | 68 | (1) | 82 | 74 | 8 | (15) | (6) | (9) |
| 70207 | Kentucky | USC | 78 | 55 | 23 | 95 | 89 | 6 | (17) | (34) | 17 |
| 70210 | Kentucky | Florida | 69 | 72 | (3) | 61 | 64 | (3) | 8 | 8 | 0 |
| 70213 | Kentucky | @ Tennessee | 73 | 74 | (1) | 85 | 89 | (4) | (12) | (15) | 3 |
| 70217 | Kentucky | @ Alabama | 72 | 69 | 3 | 61 | 72 | (11) | 11 | (3) | 14 |
| 70220 | Kentucky | LSU | 74 | 61 | 13 | 70 | 63 | 7 | 4 | (2) | 6 |
| 70225 | Kentucky | @ Vanderbilt | 71 | 72 | (1) | 65 | 67 | (2) | 6 | 5 | 1 |
| 70228 | Kentucky | Georgia | 77 | 64 | 13 | 82 | 70 | 12 | (5) | (6) | 1 |
| 70304 | Kentucky | @ Florida | 66 | 74 | (8) | 72 | 85 | (13) | (6) | (11) | 5 |
| 70308 | Kentucky | SEC ALABAMA | 75 | 66 | 9 | 79 | 67 | 12 | (4) | (1) | (3) |
| 70309 | Kentucky | SEC MISSST | 73 | 69 | 4 | 82 | 84 | (2) | (9) | (15) | 6 |
| 70316 | Kentucky | NCAA VILLANOVA | 71 | 68 | 3 | 67 | 58 | 9 | 4 | 10 | (6) |
| 70318 | Kentucky | NCAA KANSAS | 68 | 72 | (4) | 76 | 88 | (12) | (8) | (16) | 8 |
TABLE IX
RESULTS FOR 2004-05 AND 2005-06
| Date | Home |
Visitor |
Predicted |
Scores |
Predicted |
Actual |
Score |
Actual |
Margin |
Did Model |
Team |
Team |
Home |
Visitors |
Margin |
Home |
Visitors |
Margin |
Difference |
Predict |
|
Predicted |
Winner |
|||||||||
v Actual |
YES/NO |
|||||||||
| 41120 | Kentucky |
Coppin |
82 |
50 |
32 |
77 |
46 |
31 |
1 |
YES |
| 41123 | Kentucky |
BALL ST |
81 |
60 |
21 |
73 |
53 |
20 |
1 |
YES |
| 41126 | Kentucky |
GEORGIAST |
86 |
52 |
34 |
77 |
59 |
18 |
16 |
YES |
| 41130 | Kentucky |
TENNTECH |
120 |
77 |
42 |
92 |
63 |
29 |
13 |
YES |
| 41204 | UNC |
Kentucky |
85 |
63 |
22 |
91 |
78 |
13 |
9 |
YES |
| 41208 | Kentucky |
Morehead |
94 |
80 |
13 |
71 |
40 |
31 |
-18 |
YES |
| 41211 | Kentucky |
Indiana@ |
65 |
62 |
2 |
73 |
58 |
15 |
-13 |
YES |
| 41218 | Louisville |
Kentucky |
74 |
73 |
0 |
58 |
60 |
-2 |
2 |
NO |
| 41222 | Kentucky |
Will & Mary |
103 |
83 |
20 |
92 |
47 |
45 |
-25 |
YES |
| 41229 | Kentucky |
Campbell |
82 |
56 |
27 |
82 |
50 |
32 |
-5 |
YES |
| 50105 | Kentucky |
USC |
66 |
66 |
0 |
79 |
75 |
4 |
-4 |
YES |
| 50109 | Kentucky |
Kansas |
66 |
74 |
-8 |
59 |
65 |
-6 |
-2 |
YES |
| 50112 | Kentucky |
Vanderbilt |
70 |
67 |
3 |
69 |
54 |
15 |
-12 |
YES |
| 50115 | Georgia |
Kentucky |
62 |
74 |
-13 |
55 |
76 |
-21 |
8 |
YES |
| 50119 | Mississippi |
Kentucky |
62 |
72 |
-10 |
50 |
53 |
-3 |
-7 |
YES |
| 50122 | Kentucky |
LSU |
77 |
69 |
7 |
89 |
58 |
31 |
-24 |
YES |
| 50125 | Tennessee |
Kentucky |
65 |
74 |
-9 |
62 |
84 |
-22 |
13 |
YES |
| 50129 | Arkansas |
Kentucky |
67 |
70 |
-3 |
67 |
68 |
-1 |
-2 |
YES |
| 50205 | Vanderbilt |
Kentucky |
66 |
71 |
-4 |
70 |
84 |
-14 |
10 |
YES |
| 50208 | Kentucky |
Florida |
71 |
70 |
1 |
69 |
66 |
3 |
-2 |
YES |
| 50212 | Kentucky |
Georgia |
73 |
61 |
12 |
60 |
51 |
9 |
3 |
YES |
| 50215 | USC |
Kentucky |
65 |
69 |
-5 |
73 |
61 |
12 |
-17 |
NO |
| 50219 | Kentucky |
Miss St |
71 |
67 |
4 |
94 |
78 |
16 |
-12 |
YES |
| 50223 | Kentucky |
Auburn |
77 |
66 |
12 |
81 |
73 |
8 |
4 |
YES |
| 50226 | Alabama |
Kentucky |
70 |
70 |
0 |
71 |
78 |
-7 |
7 |
YES |
| 50302 | Kentucky |
Tennessee |
73 |
66 |
7 |
73 |
61 |
12 |
-5 |
YES |
| 50306 | Florida |
Kentucky |
69 |
69 |
0 |
53 |
52 |
1 |
-1 |
NO |
| 50311 | Kentucky |
Tennessee |
72 |
66 |
7 |
76 |
62 |
14 |
-7 |
YES |
| 50312 | Kentucky |
LSU |
74 |
69 |
4 |
79 |
78 |
1 |
3 |
YES |
| 50313 | Kentucky |
Florida |
70 |
69 |
1 |
53 |
70 |
-17 |
18 |
NO |
| 50317 | Kentucky |
EKU |
76 |
63 |
13 |
72 |
64 |
8 |
5 |
YES |
| 50319 | Kentucky |
Cincinnati |
71 |
69 |
2 |
69 |
60 |
9 |
-7 |
YES |
| 50325 | Kentucky |
Utah |
68 |
63 |
5 |
62 |
52 |
10 |
-5 |
YES |
| 50327 | Kentucky |
Michigan State |
70 |
71 |
-1 |
88 |
94 |
-6 |
5 |
YES |
| 51113 | Kentucky |
S. Dakota St. |
78 |
57 |
22 |
71 |
54 |
17 |
5 |
YES |
| 51114 | Kentucky |
Lipscomb |
79 |
63 |
16 |
67 |
49 |
18 |
-2 |
YES |
| 51121 | Texas |
West Virginia |
68 |
59 |
9 |
76 |
75 |
1 |
8 |
YES |
| 51121 | Kentucky |
Iowa |
60 |
69 |
-9 |
63 |
67 |
-4 |
-5 |
YES |
| 51122 | Kentucky |
W. Virginia |
67 |
69 |
-2 |
80 |
66 |
14 |
-16 |
NO |
| 51125 | Kentucky |
Liberty |
79 |
53 |
26 |
81 |
51 |
30 |
-4 |
YES |
| 51129 | Kentucky |
HighPoint |
78 |
61 |
17 |
75 |
55 |
20 |
-3 |
YES |
| 51203 | Kentucky |
UNC |
72 |
69 |
3 |
79 |
83 |
-4 |
7 |
NO |
| 51206 | Georgia St |
Kentucky |
64 |
76 |
-12 |
46 |
73 |
-27 |
15 |
YES |
| 51210 | Kentucky |
Indiana |
72 |
73 |
-1 |
53 |
79 |
-26 |
25 |
YES |
| 51217 | Kentucky |
Louisville |
67 |
70 |
-3 |
73 |
61 |
12 |
-15 |
NO |
| 51223 | Kentucky |
Iona @ Louisville (BBSN) |
73 |
66 |
7 |
73 |
67 |
6 |
1 |
YES |
| 51230 | Kentucky |
Ohio @ Cincinnati (ESPN2) |
67 |
65 |
3 |
71 |
63 |
8 |
-5 |
YES |
| 60103 | Kentucky |
Central Florida (BBSN) |
73 |
55 |
18 |
59 |
57 |
2 |
16 |
YES |
| 60107 | Kentucky |
@ Kansas (ESPN) |
67 |
66 |
-1 |
73 |
46 |
27 |
-28 |
NO |
| 60110 | Kentucky |
Vanderbilt (ESPN) |
67 |
88 |
-21 |
52 |
57 |
-5 |
-16 |
YES |
| 60114 | Kentucky |
Alabama (CBS) |
68 |
65 |
3 |
64 |
68 |
-4 |
7 |
NO |
| 60117 | Kentucky |
@ Georgia (ESPN) |
68 |
70 |
2 |
55 |
69 |
-14 |
16 |
NO |
| 60121 | Kentucky |
South Carolina (JP) |
64 |
66 |
-2 |
80 |
78 |
2 |
-4 |
NO |
| 60124 | Kentucky |
@ Auburn (ESPN) |
64 |
66 |
2 |
62 |
71 |
-9 |
11 |
NO |
| 60129 | Kentucky |
Arkansas (CBS) |
66 |
68 |
-2 |
78 |
76 |
2 |
-4 |
NO |
| 60201 | Kentucky |
@ Mississippi State (JP) |
65 |
66 |
1 |
66 |
81 |
-15 |
16 |
NO |
| 60204 | Kentucky |
@ Florida (ESPN2) |
76 |
62 |
-14 |
95 |
80 |
15 |
-29 |
NO |
| 60207 | Kentucky |
Tennessee (ESPN) |
71 |
74 |
-3 |
67 |
75 |
-8 |
5 |
YES |
| 60211 | Kentucky |
@ Vanderbilt (JP) |
71 |
64 |
-7 |
84 |
81 |
3 |
-10 |
NO |
| 60215 | Kentucky |
Georgia (JP) |
74 |
66 |
9 |
68 |
61 |
7 |
2 |
YES |
| 60218 | Kentucky |
@ South Carolina (CBS) |
72 |
62 |
-10 |
66 |
79 |
-13 |
3 |
YES |
| 60222 | Kentucky |
Ole Miss (JP) |
74 |
61 |
13 |
80 |
40 |
40 |
-27 |
YES |
| 60225 | Kentucky |
@ LSU (CBS) |
74 |
64 |
-11 |
71 |
67 |
4 |
-15 |
NO |
| 60301 | Kentucky |
@ Tennessee (JP) |
79 |
67 |
-12 |
78 |
80 |
-2 |
-10 |
YES |
| 60305 | Kentucky |
Florida |
69 |
72 |
-3 |
64 |
79 |
-15 |
12 |
YES |
| 60309 | Kentucky |
Mississippi SEC |
95 |
81 |
14 |
71 |
57 |
14 |
0 |
YES |
| 60310 | Kentucky |
Alabama SEC |
69 |
68 |
0 |
68 |
61 |
7 |
-7 |
YES |
| 60311 | Kentucky |
USC SEC |
67 |
66 |
1 |
61 |
65 |
-4 |
5 |
NO |
| 60317 | Kentucky |
NCAA UAB |
68 |
70 |
-2 |
69 |
64 |
5 |
-7 |
NO |
| 60319 | Kentucky |
NCAA UCONN |
67 |
74 |
-7 |
83 |
87 |
-4 |
-3 |
YES |
Total Predictions |
34 |
Right Picks: |
31 |
91.2% |
||||||
Averages |
74.8 |
67.7 |
7.0 |
72.3 |
63.9 |
8.5 |
-1.5 |
|||
| Through | Maximum |
120 |
83 |
42 |
94 |
94 |
45 |
18 |
||
| 2004-05 | Minimum |
62 |
50 |
-13 |
50 |
40 |
-22 |
-25 |
||
| Season | Std Dev |
12.0 |
7.1 |
13.1 |
12.1 |
12.6 |
15.9 |
10.6 |
||
Percentage |
Predicted |
103.4% |
106.1% |
|||||||
To Actual: |
||||||||||
Total Predictions |
36 |
Right Picks: |
26 |
72.2% |
||||||
Averages |
70.9 |
67.0 |
1.2 |
70.1 |
67.3 |
2.8 |
-1.6 |
|||
| 2005-06 | Maximum |
95 |
88 |
26 |
95 |
87 |
40 |
25 |
||
| Season | Minimum |
60 |
53 |
-21 |
46 |
40 |
-27 |
-29 |
||
Std Dev |
6.3 |
6.8 |
10.6 |
10.1 |
11.6 |
14.6 |
12.9 |
|||
Percentage |
Predicted |
101.2% |
99.6% |
|||||||
To Actual: |
NOTE: These Tables Provide All Predictions
beginning in November 2004 to Present
Prediction Methods are Evolving and
not all predictions presented here are based on the same methodology. Questions about the Methodology should be directed to GoBigBlue@BigBlueFans4UK.com
The above data is presented in the next series of tables providing more detail in two respects. First, the tables examine more categories of statistics, and second, the data is sorted based on the following factors, in the order shown below:
You may link to any of these sorted data pages using the links above, or you can browse them in sequence using the "Continue" buttons at the bottom of each page.
To a Summary Variances of Predicted and Actual Game Efficiencies
2010 through 20121. Pace values will be lower, by the number of offensive rebounds.
2. Efficiencies will be higher due to the lower number of total possessions
3. Turnover rates will be higher due to the lower number of possessions.
CHECK OUT THESE OTHER ANALYTICAL WRITINGS
Change in Position on Definition of Possessions
Do Objective Performance Measures Like NGE
Account For Intangible?
Copyright 2008-15
SugarHill Communications of Kentucky
All Rights Reserve