BIG BLUE FANS FOR

BASKETBALL
ANALYSIS OF THE GAME OF BASKETBALL
Why Do "Upsets" Occur?
No team plays its average every night, and there is a normal distribution of performance levels about any mean, especially when we examine human performances. When a team with an lower mean performance level competes against a team with a higher mean performance level, the outcome is not ever guaranteed. When the team of lesser talent plays better than average and the team with superior talent plays at its average or below average, upsets often occur.
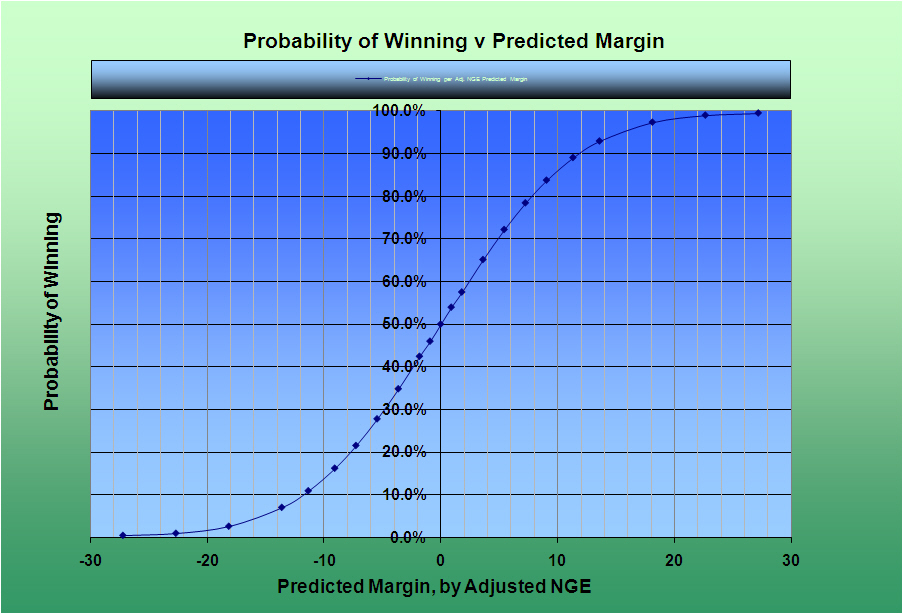
The probability of such an upset is determined by the magnitude of the separation between the two teams' average performance levels and the standard deviation between the predicted and actual game margins. When these averages are close, but different by slight amounts, the probability of an "upset" if you insist on calling it that approaches 50%. As this separation increases the probability of an upset declines. It never reaches 0%, but it does approach 0% as the difference becomes larger.

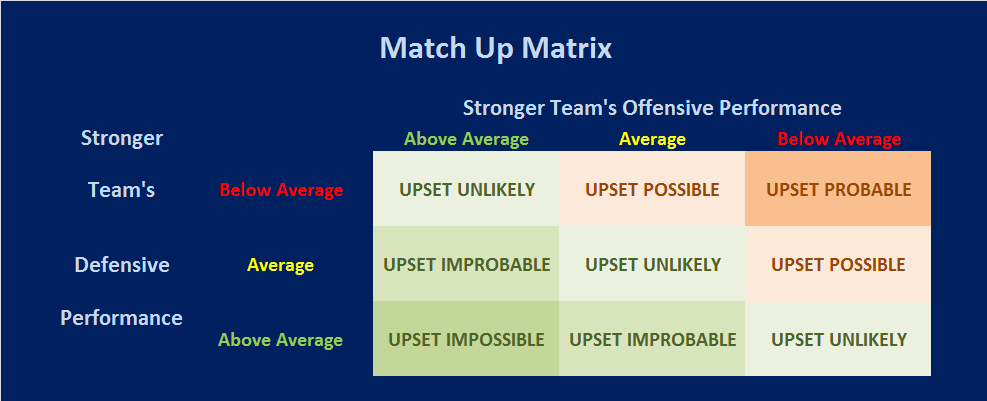
Teams that have the highest mean performance levels are only vulnerable to upset risks against a very limited number of teams, who post performance levels that are elevated, but perhaps not the highest. At the same time, teams that perform at the highest levels have virtually no real risk of upset against the vast majority of the field. However, teams that are turly elite have virtually no opportunity to get "upset" wins of their own. Similarly, teams that have the lowest mean performance levels are never vulnerable to upsets, only able to upset others, who have low mean performance levels, but not the lowest.
The vast majority of teams, the middling middle, where UK resided during the dismal Tubby Smith/Billy Gillispie eras, can upset and be upset. That means that more of their games over the course of a season, have outcomes that are uncertain prior to the game and more games that remain contested to the end of the contest. These teams will win some they "shouldn't" and lose some the "shouldn't"
Is "team chemistry" part of that equation? I think it is, and what ever contribution that "team chemistry" makes in the performance levels are real. However, there is no specific statistical measure available to isolate "team chemistry" or the other many "intangibles" that contribute to overall performance levels. Nevertheless, the impact of all of the various and sundry "intangibles" are embodied in the team's overall performance measures.
The statistical analysis applies to all games. Some games do end up with upset outcomes because the superior team played enough below its average and/or the inferior team played enough above its average to overcome the statistical differences that separate them on average.
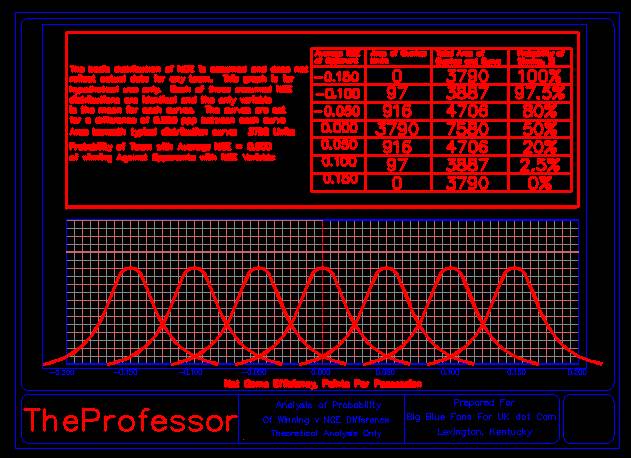
Click Here To View The Following Graphic Example in PDF Format
If you will consider a team's distribution of performance data and you should imagine the classic bell shaped curve defined in classic statistical terms with a Standard Deviation and a Mean. Consider two such curves for the opponents of a game. If both curves have the same mean and same standard deviation, they will overlap perfectly. In this special case, each team has a 50% probability of winning, e.g the total area under their curve divided by the total areas under both curves combined.
As these two bell shaped curves move apart, by either increasing the mean of one or decreasing the mean of the other, these curves no longer overlap perfectly, but they will overlap in smaller proportions. As this shift occurs, the probabilities of winning also shift. The calculation becomes the area of over lap for the underdog divided by the total area of the favorite plus the total area of the underdog divided by 2. As the shift continues to become greater, eventually, the amount of the overlap will approach zero, at which time the probability of any upset occurring also approaches zero.
Many fans have observed that recent UK teams are inconsistent and more prone to being upset as a result of their inconsistency. However, an examination of the statistical relationships describe above illustrate why recent UK's team have been more prone to upset over the last few years is not inconsistency, but a decline in the quality of play. The standard deviation about UK's mean performance level has remained within a fairly narrow range. However, the mean value of that performance has fallen.
When a team moves from near the top levels of performance toward lower levels of performance, more and more games become "competitive" because competitiveness increases on the upside and remains constant on the downside as means fall. Therefore, you see a team that does indeed win games that most think it should lose, and losing games that most believe they should win. However, when a team is at the top of the game, the only "upsets" that can occur are on the downside. This creates a false perception of inconsistency, and the talking heads on TV and radio will talk about the inconsistency endlessly, but in fact the consistency, measured by the standard deviation about a mean, remains the same.

Facts About Upsets:
As noted previously, an upset occurs when a team having a higher average ANE loses to a team having a lower average ANE. Furthermore, as the theoretical margin, as defined by the difference between the average ANE values plus the venue adjustment, increases, the probability of the better team (favored team) winning increases from 50% when the ANE values are equal to 100% as the theorectical margin becomes very large. Therefore, any study of upset rates must account for these type of variations.
For the past 5 basketball seasons (2013-2017) I have tracked upset rates for all D1 basketball games. I sorted each game into five probability categories:
Range ID |
Minimum Probability For Favored Team |
Maximu Probability For Favored Team |
50's |
50.0% |
59.9% |
60's |
60.0% |
69.9% |
70's |
70.0% |
79.9% |
80's |
80.0% |
89.9% |
90's |
90.9% |
99.9% |
| Win Probability Never Reaches 100% |
||
Over these five seasons, there have been an average of 5,517 games per year (Maximum 5,540 in 2017, Minimum 5,479 in 2012) and an average of 1,450 upsets per year (Maximum 1,463 in 2015, Minimum 1,428 in 2013). The average overall upset rate is 26.3% (Maximum 26.4% in 2015, Minimum 26.1% in 2013). The upset rates for the ranges identified above have been:
Range ID |
Number of Games |
Theor. No. of Upsets |
Theor. Upset Rate, % |
Actual Number of Upsets |
Actual Upset Rate, % |
50's |
1110 |
500 |
45.0 |
499 |
45.0 |
60's |
1179 |
413 |
35.0 |
424 |
36.0 |
70's |
1161 |
290 |
25.0 |
307 |
26.5 |
80's |
1116 |
167 |
15.0 |
175 |
15.7 |
90's |
951 |
48 |
5.0 |
45 |
4.8 |
All Games |
5517 |
1318 |
23.9 |
1450 |
26.3 |

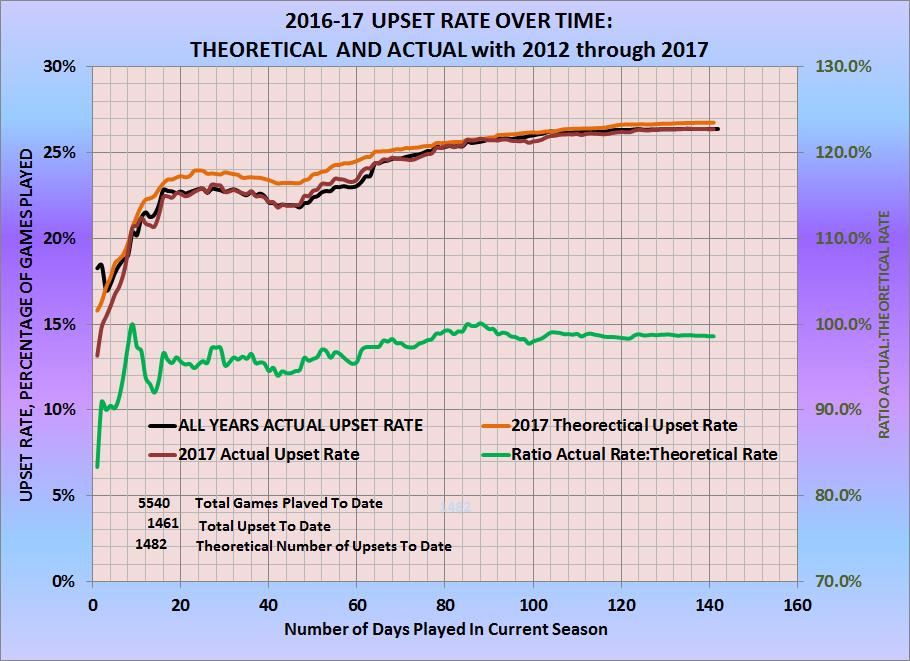
There is a common pattern to the upset rate over the course of a season. The graph above shows the upset rate over the course of the most recent full season. The Black track is the average upset rate over time for all seasons, 2012-2017, and the dark red and gold tracks are the actual and theoretical upset rates for the 2016-17 season. One should note how the shape/pattern of the upset rate from the beginning of the season to the end for 2017 overlaps the average for the 5 seasons almost identically. The following observations apply:
- At the beginning of the season, the upset rate starts at its lowest value for the season, and climbs steadily for the first month of the season (Early November to Early December) before it peaks between days 24 to 30.
- From early December to late December (about 3 weeks), the upset rate slips gradually before reaching a local low point between Christmas and New Year.
- For the post Christmas local low point, the upset rate climbs steadily to the end of the season.
This pattern has occurred each season for which I have tracked upset rates. It is also important to note that the theoretical upset rate follows the same pattern, even though the theoretical upset rate is higher than the historic or single season actual upset rate. This indicates that the pattern is tied to the scheduling that occurs that provides higher average win probabilities during the middle (declining) segment of the season, as teams load up on cupcake opponents in early December through the holidays. Furthermore, the third stage indicates the much lower average win probabilities assoicated with conference competition that begins in very late December and very early January.
Submitted by Richard “TheProfessor” Cheeks
CHECK OUT THESE OTHER ANALYTICAL WRITINGS
Change in Position on Definition of Possessions
WHAT IS THEORETICAL BASIS FOR GAME ANE CALCULATION
Do Objective Performance Measures Like ANE
Account For Intangible?
Copyright 2006, 2010, 2018
SugarHill Communications of Kentucky
All Rights Reserved
