BIG BLUE FANS FOR
![]()
 FOOTBALL
2010
2010 Pre-Season Football Forecast
by Richard Cheeks
INTRODUCTION:
Prior to each football season, I project the entire season's results based solely upon Kentucky's and each of Kentucky's upcoming opponents' body of work during the prior season, in this case 2009. As the new season [2010] unfolds over the first 4 games for each team, I update and modify the season projections based upon initially a weighting between the per game averages for the prior and current season, with complete reliance upon the current season statistics after a team has completed its 4 th game of the year. This transformative analysis is based upon observations that teams tend to reveal their current identity by the time it has played four games in a season and that most teams do not deviate from their prior season level of performance moving forward.
The following analysis is the pre-season examination of Kentucky's 2010 schedule based solely upon the 2009 performance levels for Kentucky and each of its 2010 regular season opponents.
COMPARISON OF 2009 PERFORMANCE MEASURES:
Scoring
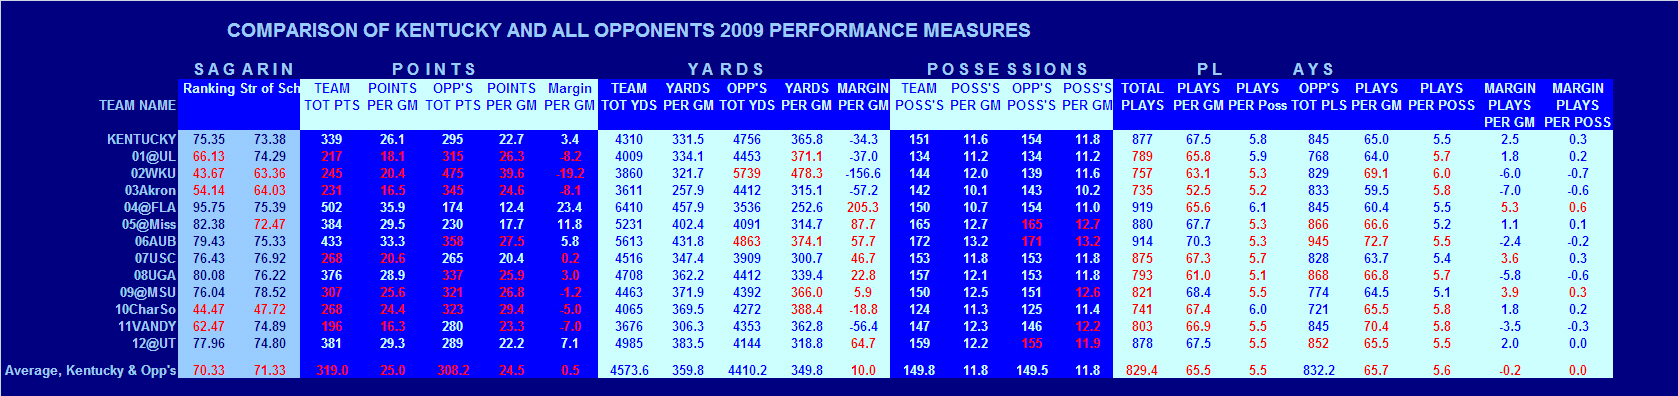
A review of performance standards for SEC teams over recent years reveals that teams that rise to the top of the SEC score well. The top-flight SEC offenses average over 30 points per game. Last season, the Cats averaged about 26 ppg and allowed almost 23 ppg. Among this season's opponents, seven of them averaged fewer points per game than the Cats and five 2010 opponents had more potent offenses than UK. The 2010 opponents that had better offensive production were Florida [36.9 ppg], Auburn [33.3 ppg], Mississippi [29.5 ppg], Tennessee [29.3 ppg], and Georgia [28.9 ppg]. Of these, Florida and Auburn had top tier SEC offenses.
Scoring Defense
A review of performance standards for SEC teams over recent years reveals that teams that rise to the top of the SEC also defend well. Top-flight SEC defenses allow fewer than 20 ppg. Last season, the Cats allowed its opponents to score an average of 22.7 ppg. Among this season's opponents, eight of them allowed their opponents to score more points per game than the Cats and four 2010 opponents had stingier defenses than UK. The 2010 opponents that had better defensive production were Florida [12.4 ppg], Mississippi [17.7 ppg], South Carolina [20.4 ppg], and Tennessee [22.2 ppg. Of these, Florida, Mississippi, and Tennessee combined their better defensive output with their better offensive performances. Of these, Florida and Mississippi had top tier SEC defenses.
Scoring Margin
Overall, the Cats posted an average margin against all 2009 opponents of +3.4 ppg. Eight of the Cats' 2010 opponent had lower average margins and four 2010 opponents had higher average margins in 2009. Among the teams with lower average margins, two teams had margins between the Cats' 3.4 ppg and 0 ppg, South Carolina [+0.2 ppg] and Georgia [+3.0 ppg]. The teams with better margins are Florida [+23.4 ppg], Mississippi [+11.8 ppg], Tennessee [+7.1 ppg], and Auburn [+5.8 ppg]. Of these, the margins posted by Florida and Mississippi were top tier SEC levels.
Yards Gained and Allowed
Largely, football teams that score more also gain more yards, and teams that allow fewer points are teams that allow fewer yards. However, another component of scoring is the number of possessions that a team can manage to get on average in a game. The Cats averaged 331.5 yards per game and allowed 365.8 yards per game in. With respect to yardage, nine of UK's 2010 opponents averaged more yards per game than the 2009 Cats, and seven 2010 opponents allowed fewer yards per game than the Cats. Five teams both gained more and allowed fewer yards than the Cats in 2009: Florida [+205.3 yds/gm], Mississippi [+87.7 yds/gm], Tennessee [+64.7 yds/gm], South Carolina [+46.7 yds/gm], and Georgia [+22.8 yds/gm]. Of these, Florida was clearly the class of the group.
Possessions
With respect to possessions, Kentucky averaged 11.6 possessions per game in 2009. The highest number of possessions was 13.2 [Auburn] and the lowest was 10.1 [Akron], and the average was 11.8. Eight of the twelve 2010 opponents average more possessions per game than the Cats, and only Charleston Southern [11.3], Louisville [11.2], Florida [10.7], and Akron [10.1] averaged fewer possessions.
Schedule Strength
The final statistical comparison is schedule strength. For this comparison, I have adopted the Sagarin rating schedule strength. In 2009, the Average Sagarin Schedule Strength was 60.49, and the Cats' 2009 Schedule strength was 73.38. All of the Cats' 2010 opponents played a schedule that was tougher than the NCAA D1 average except one, Charleston Southern. Eight of the Cats' 2010 opponents played a more difficult schedule in 2009 than the Cats, and four that played weaker schedules were Mississippi [72.47], Akron [64.03], WKU [63.36], and Charleston Southern [47.72].
The following Table presents the comparison of 2010 opponents' 2009 statistical results.
 Click Image For Full Size View of Table-USE "BACK" Button To Return To This Page
The following Table provides further detail for UK and each 2010 opponent regarding how each team utilized its available possessions during the 2009 season.
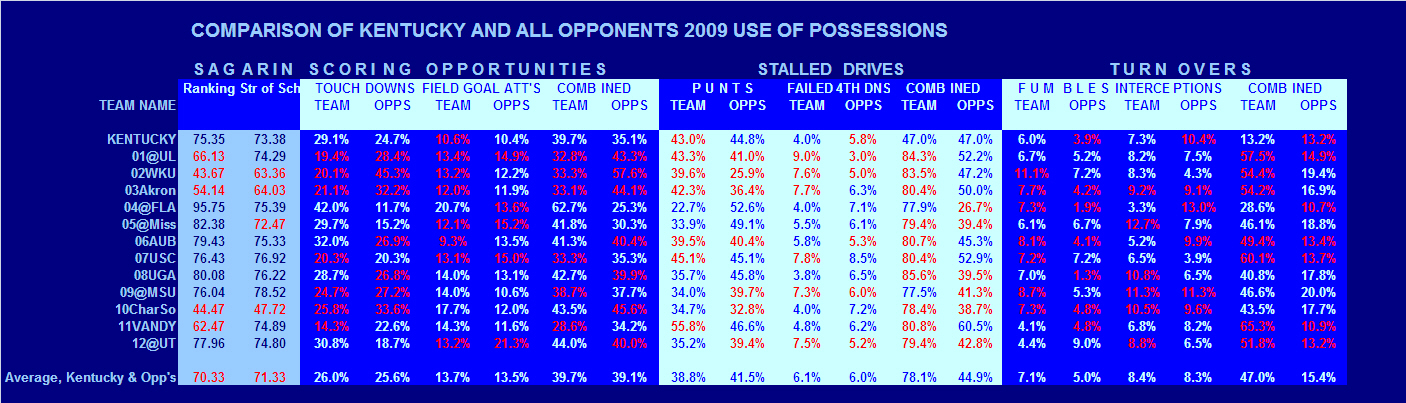
Click Image For Full Size View of Table-USE "BACK" Button To Return To This Page
PROJECTIONS FOR 2010 SEASON:
Prediction Methods
I use three different methods to project the 2010 season results: Sagarin, Direct Statistical Comparison, and my NGE method. For Sagarin, the predicted margin is based on the algebraic difference between the teams' respective rankings with a home field adjustment provided by Sagarin applied, and the score is based upon the average total points scored and allowed by both teams, with the Sagarin Margin applied. The direct statistical approach and the NGE methods are my proprietary methods currently under development. In addition, I also track the effectiveness during the season of the Vegas line, which should be self-explanatory, and I project results using a Comparative Yardage procedure. However, I cannot apply the Vegas and Comparative Yardage methods at this time for pre-season projections because the data required for them does not become available until the season play begins.
During the 2009 season, the standard deviation for the 13 UK games between predicted and actual margin by these methods were:
NGE Method: 5.8 pts
Sagarin: 10.4 pts
Vegas Lines: 13.2 pts
Comparative Yardage Method: 13.3 pts
Statistical Analysis: 15.5 pts
Clearly, the NGE Method was the most reliable method last season. Sagarin was second most reliable. The Comparative Yardage Method and Vegas produced similar results, and the Statistical Analysis was the least reliable of these five methods.
Overview of 2010 Opponents/Schedule:
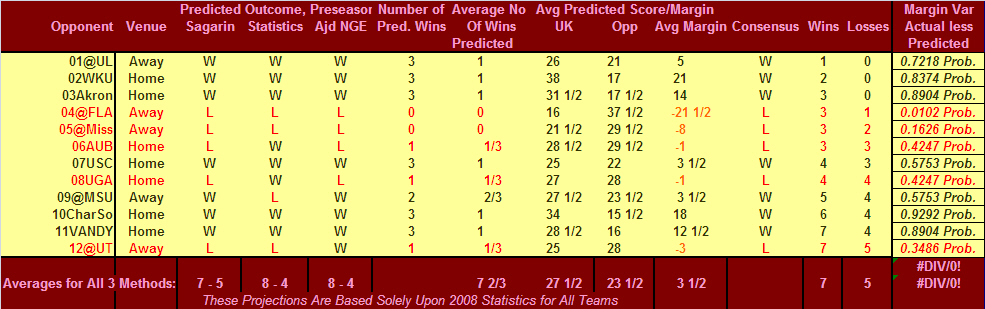
The 2010 Season includes seven games at Commonwealth and five games on the road. In my opinion, there are six clear wins, one probable win, and one clear loss on the 2010 schedule. The loss is at Florida, and the only reason that Ole Miss is not included in this dubious category is the deep personnel losses they have had since last season. However, to be clear, none of the predictive methods presented here indicate a Kentucky win at Ole Miss in 2010. The Clear wins are at Louisville, and home games against WKU, Akron, South Carolina, Charleston Southern, and Vanderbilt. The probable win is at Mississippi State. The outcomes of the remaining four games will largely determine the success of the 2010 season for the Cats: Auburn and Georgia at Commonwealth and at Ole Miss, and at Tennessee.
Projected Season Records
If the Cats win one of those four pivotal games, then the Cats will finish the 2010 season 8-4 and 4-4 in the SEC. This is the projected outcome using the NGE and Statistical Analysis methods, but these two methods project different outcomes in the critical swing games. The NGE Method projects UK wins at Mississippi State and a season ending win at Tennessee. The Statistical Method projects UK wins at home against Auburn and Georgia. The Sagarin method, based on year ending 2009 values, projects a 7-5 season with the Cats losing all four of the pivotal games and finishing the season 3-5 in the SEC. The composite prediction, using the average predicted scores from the three predictive models, produces a predicted 7-5, 3-5 outcome too.
Projected Scoring and Margins
The pre-season scoring projections suggest a slight improvement over the 2009 scoring with a slight erosion in defense and an almost identical margin, with the Cats averaging 27 1/2 points per game and allowing 23 1/2 points per game. The NGE Methods projects average scoring of 28 to 22 ½ with an average margin of 5 1/2 ppg. As a reminder, all of these projections are based solely upon the 2009 results, and these projections will not become meaningful for 2010 until UK and its opponents have played at least 4 games of their respective 2010 schedules.
The following Table provides the pre-season projections based on the three methods identified discussed previously.
I will update this following table after each week's play to reflect the actual results and the projections for the remaining games based upon the actual 2010 statistics. Use the Links at the bottom of this and subsequent pages to view these updates after each week of play.
Click Image For Full Size View of Table -USE "BACK" Button To Return To This Page
GOALS FOR 2010:
The primary goal for 2010 for the Kentucky Football team should be to win at least eight games and to win at least as many SEC games as they lose. To achieve that goal, the Cats will need to improve offensive and defensively in terms of scoring and yardage.
Scoring Goals
In 2010, the Cats need to increase their average per game scoring from the 26.1 ppg they posted in 2009 to at least 29 ppg, and preferably over 30 ppg. At 29 ppg, the Cats would be as good as or better than all but four of their 2010 Opponents' 2009 results, and at 30 ppg, the Cats would be as good or better than all but two of their 2010 Opponents' 2009 results.
In 2010, the Cats need to improve their average defense against scoring from 22.7 ppg to less than 21 ppg and preferably under 20 ppg. At 21 ppg, the Cats would be as good as or better nine of their 2010 Opponents' 2009 results, and at 20 ppg, the Cats would be as good as or better than ten of their 2010 Opponents' 2009 results.
Yardage Goals
In 2010, the Cats need to increase their average offensive output from 2009's 331.5 yards per game to at least 380 yds/gm, and preferably over 400 yds/gm. AT 380 yds/gm, the Cats would be as good as or better than eight of their 2010 Opponents' 2009 results, and at 400 yds/gm, the Cats would be as good as or better than nine of their 2010 Opponents' 2009 results.
In 2010, the Cats need to decrease their average defensive output from 365.8 yards per game in 2009 to no more than 315 yds/gm and preferably no more than 305 yds/gm. At 315 yds/gm, the Cats would be as good as or better than eight of their 2010 Opponents' 2009 results, and at 305 yds/gm, the Cats would be as good as or better than ten of their 2010 Opponents' 2009 results.
2010 Season Projections Based Solely on 2009 Season Statistics for All Teams

See How Games 1 through 4 Changed The Forecast
Submitted by Richard Cheeks
Copyright 2010
SugarHill Communications of Kentucky
All Rights Reserved