BIG BLUE FANS FOR
![]()
 FOOTBALL
2013
2013 Pre-Season Football Fearless Forecast
by Richard Cheeks
INTRODUCTION:
Prior to each football season, I project the entire season's results based solely upon Kentucky's and each of Kentucky's upcoming opponents' body of work during the prior season, in this case 2012. Beginning with the 2013 Pre-Season Forecast, I have adopted a new methodology to define the starting point for each team. Rather than taking the previous season ending statistics as the starting point, I have established the program trends for Kentucky and each of its opponents, and projected 2013 Sagarin Rankings based on this trend.
As the new season [2013] unfolds for each team, I will update and modify the season projections based upon the results that are completed and a weighting between the per game averages for the prior and current season, with complete reliance upon the current season statistics after a team has completed its 4 th game of the year. I base this transformative analysis upon observations that teams tend to reveal their current identity by the time it has played four games in a season and that most teams do not deviate a significant amount from their prior season level of performance moving forward.
Part I is a look back, a review of Kentucky's 2012 performance in several key performance measures including Scoring; Scoring Defense; Scoring Margin; Yards-Gained, Allowed, and Margin; Possessions; and Schedule Strength. Part II is a look ahead at the upcoming 2013 football season, again focusing on the same array of performance measures. Part II projects the entire season based on 2012 season ending performance levels and identifies performance goals for this team for Kentucky's season to conclude in harmony with results that most Big Blue Fans hope happen.
The following analysis is the pre-season examination of Kentucky's 2013 schedule based solely upon the 2012 performance levels for Kentucky and each of its 2013 regular season opponents. Eight of Kentucky's twelve 2013 Opponents were 2012 Bowl teams, and Alabama is the defending National Chmapion. The non-bowl opponents in 2012 are Miami (Ohio), Alabama State, Missouri, and Tennessee.
COMPARISON OF 2012 PERFORMANCE MEASURES AGAINST 2013 OPPONENTS:
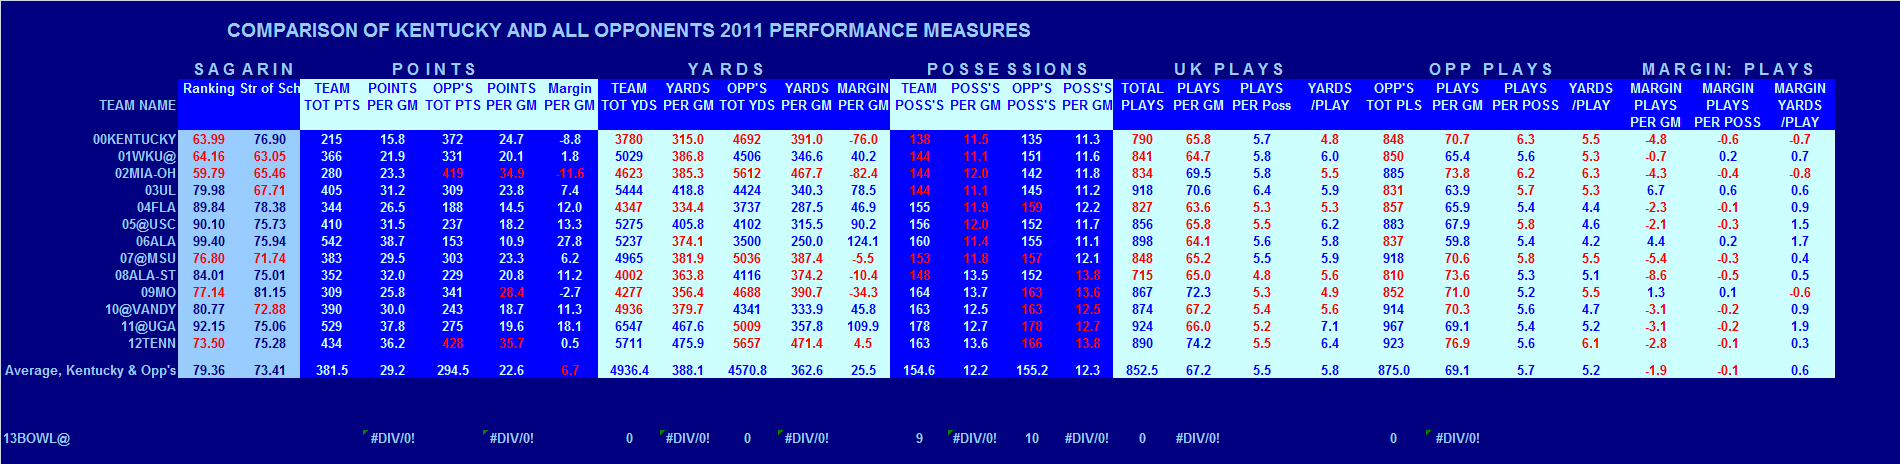
Scoring
A review of performance standards for SEC teams over recent years reveals that teams that rise to the top of the SEC score well. The top-flight SEC offenses average over 35 points per game. Unlike the 2010 Cats who averaged over 31 points per game, the 2012 Cats averaged UNDER 18 points per game. Every 2013 Kentucky opponent averaged more points per game than the Cats last season. In fact, three 2013 opponents (Alabama, Georgia, and Tennessee) averaged over 35 ppg, and four more 2013 opponents (South Carolina, Alabama State, Vanderbilt, AND Louisville) averaged between 30 and 35 points per game. The average offensive production of all 2013 Opponents is nearly 31 ppg (30.9 ppg).
Scoring Defense
While the 2012 UK offense was the least potent in the SEC, its defense also remained too porous to allow the Cats to be competitive despite it anemic offense, allowing 31 points per game on the year. A review of performance standards for SEC teams over recent years reveals that teams that rise to the top of the SEC also defend well, and top-flight SEC defenses allow fewer than 22 points per game. Last season, the Cats allowed its opponents to score an average of 31.0 points per game, up from its pathetic 28 points per game allowed in 2010 and 2011..
Among this season's opponents, two of them allowed their opponents to score more points per game than the Cats (Miami of Ohio, 34.9 points per game and Tennessee, 35.7 points per game), and ten 2013 opponents had stingier defenses than UK. Among the 2013 opponents that had stingier defenses than the Cats, six of them allowed fewer than 22 points per game (Alabama, 10.9 ppg, Florida, 14.5 ppg, South Carolina, 18.2 ppg, Vanderbilt, 18.7 ppg, Georgia, 19.6 ppg, and Alabama State, 20.8 ppg,). Louisville and Mississippi State were just over the 22.0 points per game threshold at 23.8 ppg and 23.3 ppg, respectively.
Scoring Margin
Overall, the Cats posted an average margin against all 2012 opponents of -13.1 points per game, down from 2011's -8.8 points per game. None of the Cats' 2013 opponents had lower average margins. Two 2013 opponents ended 2011 with a negative scoring margin (Miami of Ohio, -11.6 points per game, and Missouri, -2.7 points per game). The teams with positive margins are Tennessee [+0.5 ppg], Western Kentucky [+2.7 ppg], Mississippi State [+6.2 ppg], Louisville [+7.4 points per game], Alabama State [+11.2 ppg], Vanderbilt [+11.3 ppg], Florida [+12.0 ppg], South Carolina [+13.3], Georgia [+18.1 ppg], and Alabama [+27.8 ppg]. Of these, the margins posted by South Carolina, Georgia, and Alabama were top tier SEC levels.
Yards Gained and Allowed
Largely, football teams that score more also gain more yards, and teams that allow fewer points are teams that allow fewer yards. The Cats averaged 315.0 yards per game and allowed 391.0 yards per game in 2012. With respect to yardage gained, all of UK's 2013 opponents averaged more yards per game than the 2012 Cats, and four 2013 opponents averaged over 400 yards per game in 2012. Only two 2013 opponentsallowed more yards per game than the Cats' 391.0 yards per game, Miami of Ohio, 467.7 yards per game and Tennessee, 471.4 yards per game. Two 2013 opponents allowed less than 300 yards per game during 2012, Florida [287.5 yards per game], and Alabama [250.0 yards per game]. One of the 2013 opponents had a lower per game Net Yardage than the Cats' -76.0 yards per game average in 2012, Miami of Ohio (-82.4 yards per game), and only two others had negative Net Yardage, Missouri [-34.3 yards per game], Mississippi State [-5.5 yards per game] and Kent State [-71,7 yards per game].
Possessions
Another component of scoring is the number of possessions that a team can manage to get on average in a game. With respect to possessions, Kentucky averaged 11.4 possessions per game in 2012, down about 1 1/2 possession per game from 2011. The highest number of possessions was 13.7 [Tennessee] and the lowest was 11.1 [Louisville], and the average was 12.2 possessions per game. Nine of the twelve 2013 opponents averaged more possessions per game than the Cats.
Schedule Strength
The final statistical comparison is schedule strength. For this comparison, I have adopted the Sagarin rating schedule strength. In 2012, the Average Sagarin Schedule Strength was 61.67, and the Cats' 2012 Schedule strength was 76.90, up from the 72.18 Schedule Strength in 2011. All twelve Cats' 2013 opponents played a schedule that was tougher than the NCAA D1 average. Only one 2013 opponent played a more difficult schedule in 2012 than the Cats, Flordia (78.38).
The following Table presents the comparison of 2013 opponents' 2012 statistical results.
The following Table provides further detail for UK and each 2013 opponent regarding how each team utilized its available possessions during the 2012 season.

PROJECTIONS FOR 2013 SEASON:
Prediction Methods
I use three different methods to project the 2013 season results: Sagarin (Using Trend Projection Method), Direct Statistical Comparison, and my NGE method. For Sagarin, the predicted margin is based on the algebraic difference between the teams' respective rankings with a home field adjustment provided by Sagarin applied, and the score is based upon the average total points scored and allowed by both teams, with the Sagarin Margin applied. The direct statistical approach and the NGE methods are methods I have developed. In addition, I also track the effectiveness during the season of the Vegas line, which should be self-explanatory, and I project results using a Comparative Yardage procedure. However, I cannot apply the Vegas and Comparative Yardage methods at this time for pre-season projections because the data required for them does not become available until the season play begins.
During the 2009, 2010, 2011, and 2012 seasons, the standard deviation for the 38 UK games between predicted and actual margin by these methods were:
NGE Method: 16 1/2pts
Sagarin: 14 pts
Vegas Lines: 13 1/2 pts
Statistical Analysis: 14 pts
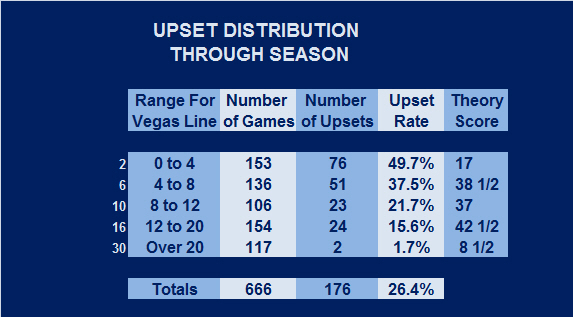
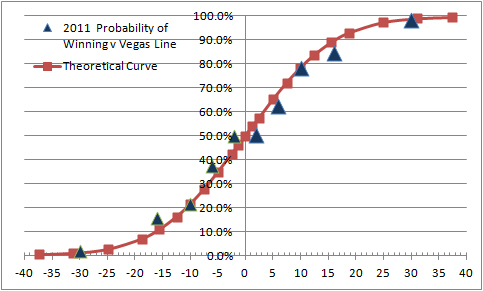
In 2012, I tracked the upset rates for all NCAA D1 football games through the bowl season. There were 666 games played. Of those, 153 games had a Vegas line between 0 and 4 points [Average 2 points], 136 games had a Vegas line between 4 and 8 points [Average 6 points], and so forth as shown in the Table below. The upset rates, sorted and computed based upon the Vegas lines are also provided. The adjacent graph provides the probability of winning based on the Vegas Line. The red curve is the theoretical relationship based on standard statistical analyses using a normal distribution, and the Blue Triangles are the results from the 2011 Season. For the season, considering all games, the upset rate was 26.4%.
Overview of 2013 Opponents/Schedule:
The 2013 Season includes seven games at Commonwealth, and four games on the road, and one game at a neutral location.. In my opinion, there are two clear wins [Miami of Ohio, and Alabama State] and sever clear losses [Florida, @ South Carolina, Alabama, @ Mississippi State, @ Vanderbilt, and @ Georgia] on the 2013 schedule. The outcomes of the remaining three games will largely determine the success of the 2013 season for the Cats: Western Kentucky @ Nashville, Louisville, and Missouri.
Projected Season Records
For the Cats to return to bowl eligibility in 2013, they will need to hold serve on the two likely wins, win all three of the competitive games, and pick off one of the 7 opponents that will enter the season favored by more than 2 touchdowns to beat the Cats. The projected outcome by the three predictive methods indicate that the Cats will only be favored to win 3 games on their schedule, and finish 3-9, 0-8. Last season's analysis predicted a 4-8 (Sagarin Methods) and 3-9 ( Statistical Comparison and Adjusted NGE), and the Cats dropped one game (Western Kentucky) that the pre-season analysis placed in the prospective W column by all three methods. In 2010, these methods projected a 6-6, 2-6 in the SEC, which was the outcome for 2010. Will 2013 be the season in which the Cats out perform these pre-season projections?
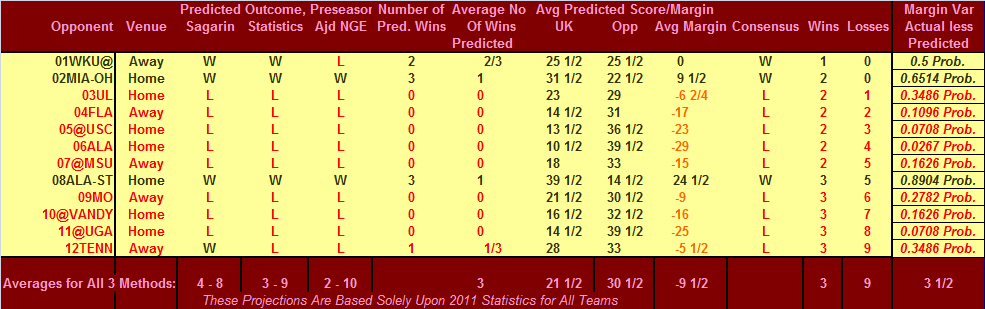
Projected Scoring and Margins
The pre-season scoring projections suggest a marginal improvement from the 2012 scoring and margin, with the Cats averaging about 21 1/2 points per game and allowing about 30 1/2 points per game, e.g. average margin -9 points per game. The NGE Method projects average scoring of 20.9 to 26.3, with an average margin of -5.4 points per game. As a reminder, all of these projections are based solely upon the 2012 results, and these projections will not become meaningful for 2013 until UK and its opponents have played at least 4 games of their respective 2013 schedules.
The following Table provides the pre-season projections based on the three methods identified discussed previously.
GOALS FOR 2013:
The primary goal for 2013 for the Kentucky Football team should be to win at least four games to stop the recent programmatic slide, and begin the climb back to competitiveness and bowl eligibility. Last year, the program continued its slide under Coach Joker Phillips, and he is now the "former" coach. The new coach, Mark Stoops, has generated a level of excitement about the future of this program that I have not seen from a coach who has not put a single team on the field of play against a real opponent. Recruiting success for the incoming 2013 freshman class was impressive in the short time he had to work the recruiting trail after his hire on November 27, 2012, but his early commitments for the 2014 class (next year's incoming) has elevated this program into a position that is generating comments on a national basis for the first time in my memory. One recuriting services rated the UK commitments as the best in the nation.
The excitement is real. The question that remains is whether this unprecedented excitement has a basis. To be fair to Coach Stoops, the answer to this question really requires more than 1 season, or even 2 seasons to answer. Patience now is essential, but given a fan base that has been starved for football success, patience may not be a huge commodity in the Blue Grass. For this reason, to maintain this excitement, Coach Stoops' first season at the helm needs to get the 5 wins that are in play to keep the cauldron of excitement boiling. Six wins in 2013 would send this fan base into orbit, and a bowl win on top of that would make Mark Stoops eligible for high political office in the Commonwealth.
Scoring Goals
In 2013, the Cats need to increase their average per game scoring from the 21 1/2 points per game currently projected to at least 26 points per game. In 2013, the Cats need to improve their average defense against scoring from the currently projected 30 1/2 points per game allowed to no more than 25 points per game.
Yardage Goals
In 2013, the Cats need to increase the offensive production from the anemic 315 yards per game it generated in 2012 to at least 390 yards per game in 2013. In 2013, the Cats need to decrease their average defensive output from 391.0 yards per game in 2012 to no more than 360 yards per game in 2013.
CHECK OUT AN UPDATE OF THE PRE-SEASON PROJECTION AT THIS LINK:
UK fan, and owner of http://bigbluefans4uk.com

See How Games 1 through 4 Changed The Forecast
Submitted by Richard Cheeks
Copyright 2013
SugarHill Communications of Kentucky
All Rights Reserved