|
BIG BLUE FANS FOR

BASKETBALL
SUMMARY OF EFFICIENCY VARIATIONS FOR
KENTUCKY BASKETBALL GAME
2011-2016
TABLE V
RESULTS FOR 2015-16
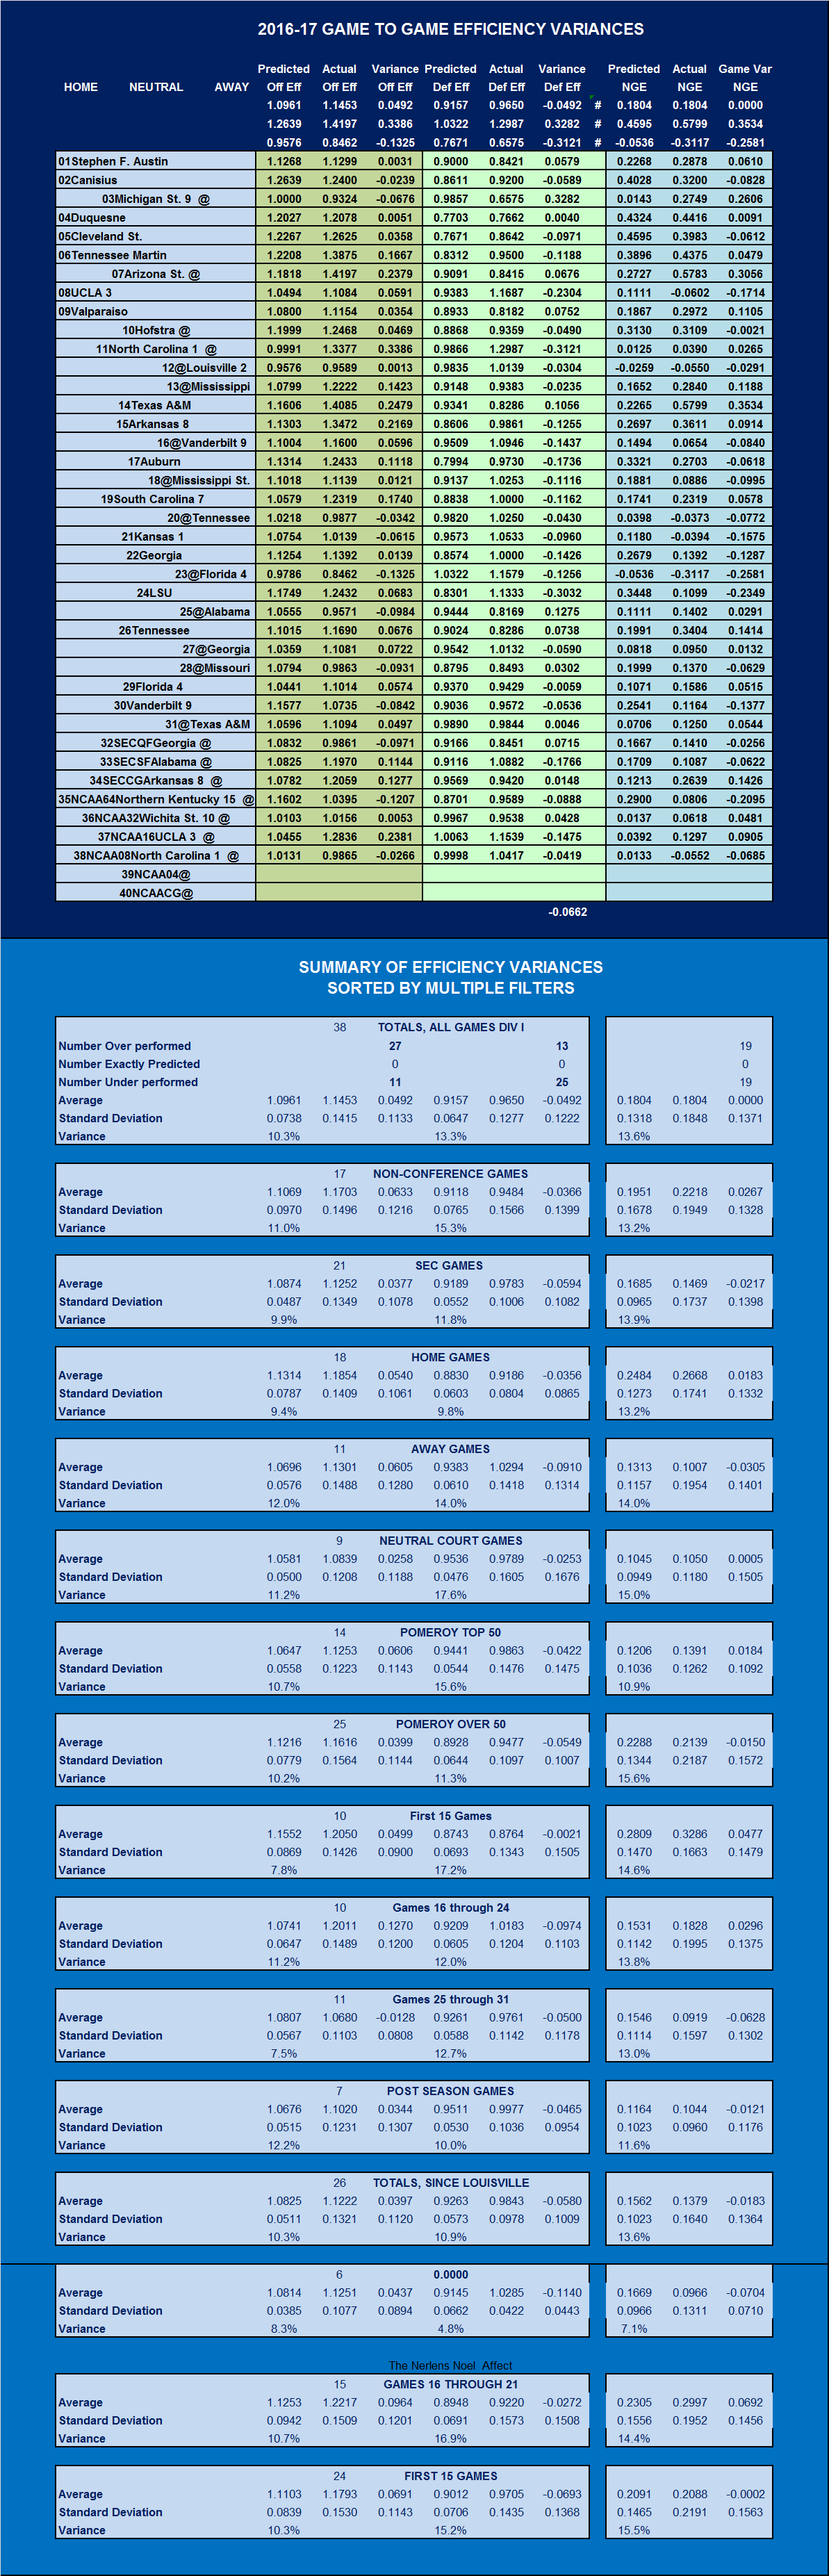
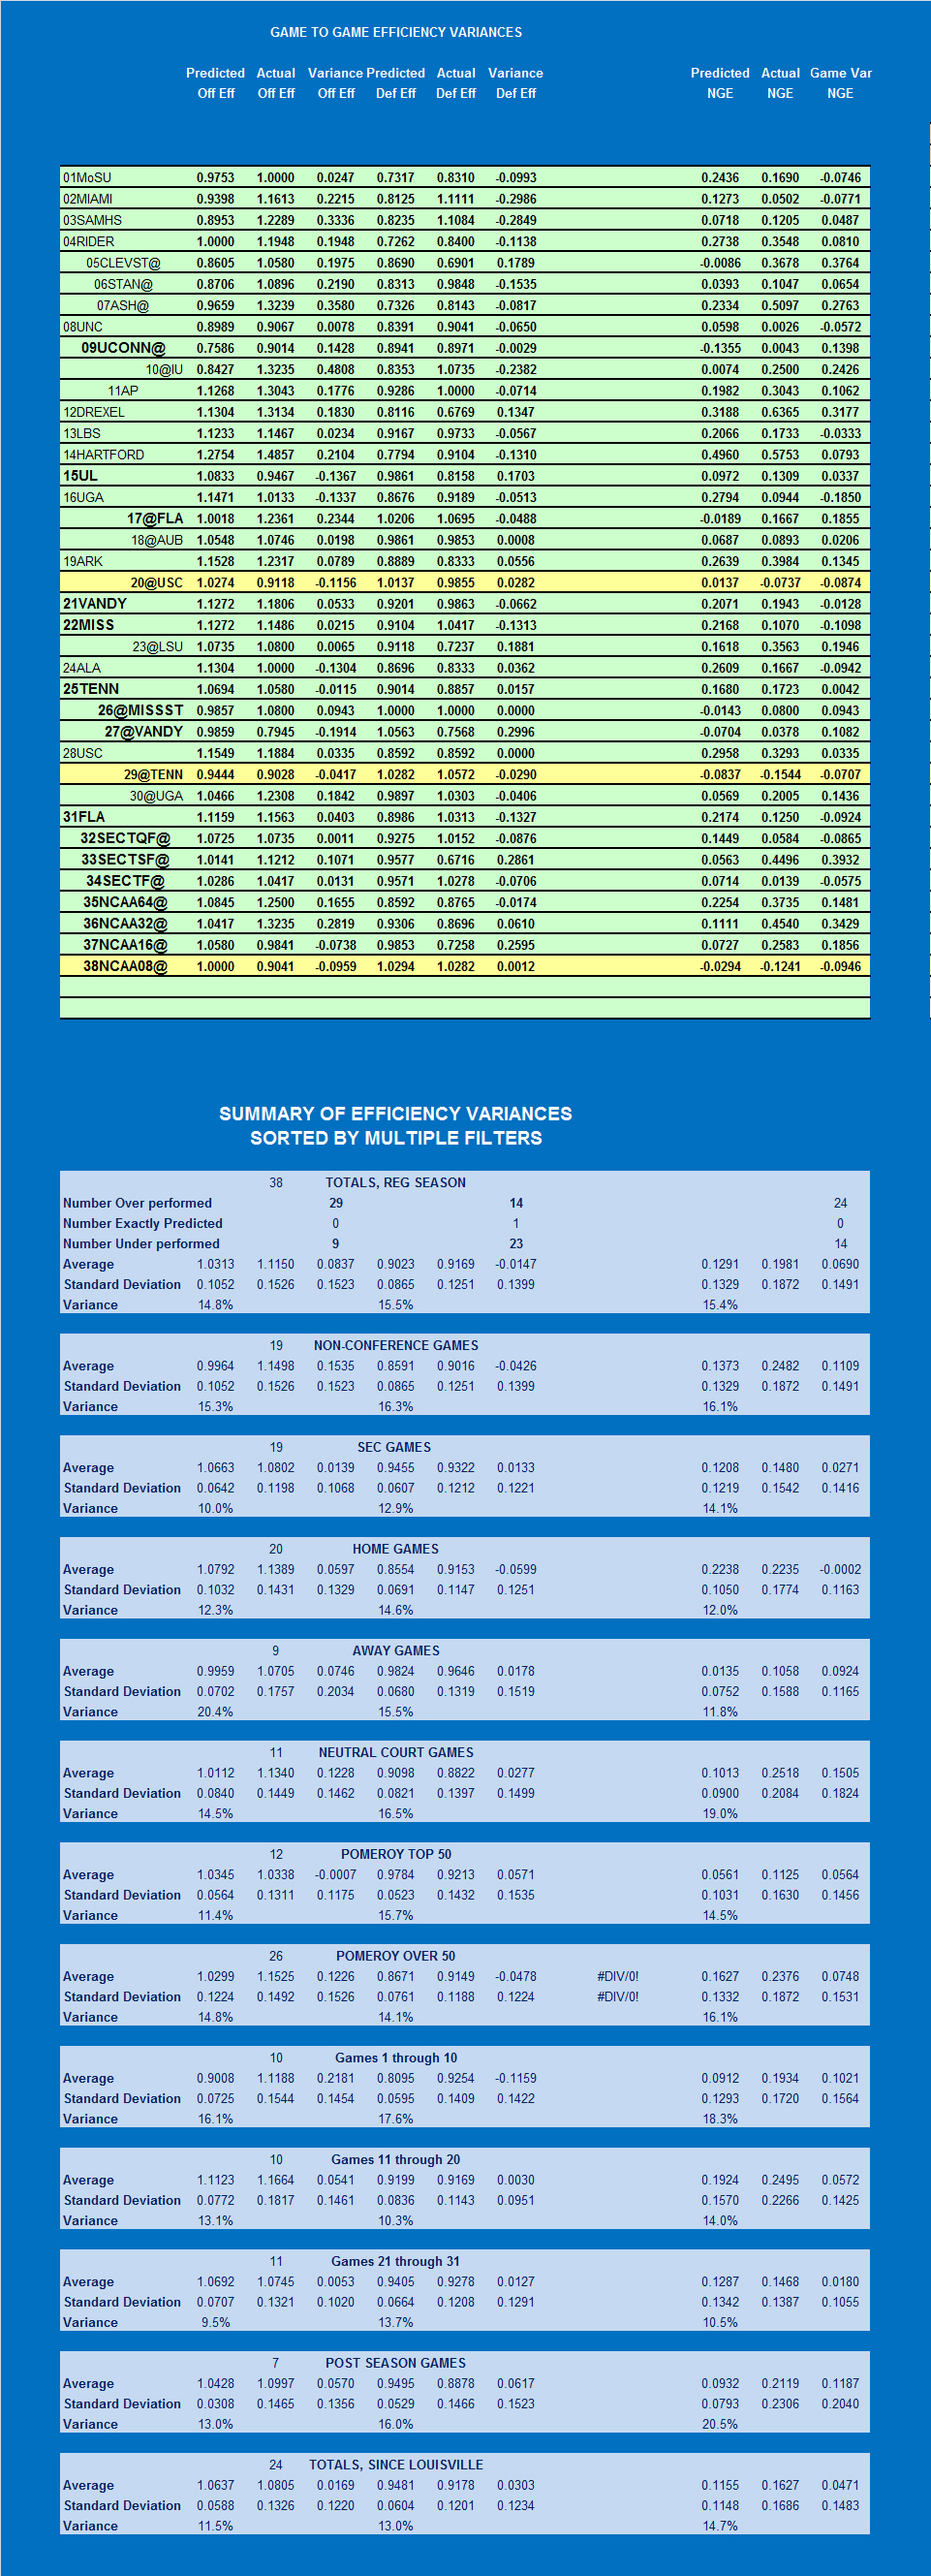
TABLE IV
RESULTS FOR 2014-15
TABLE III
RESULTS FOR 2013-14
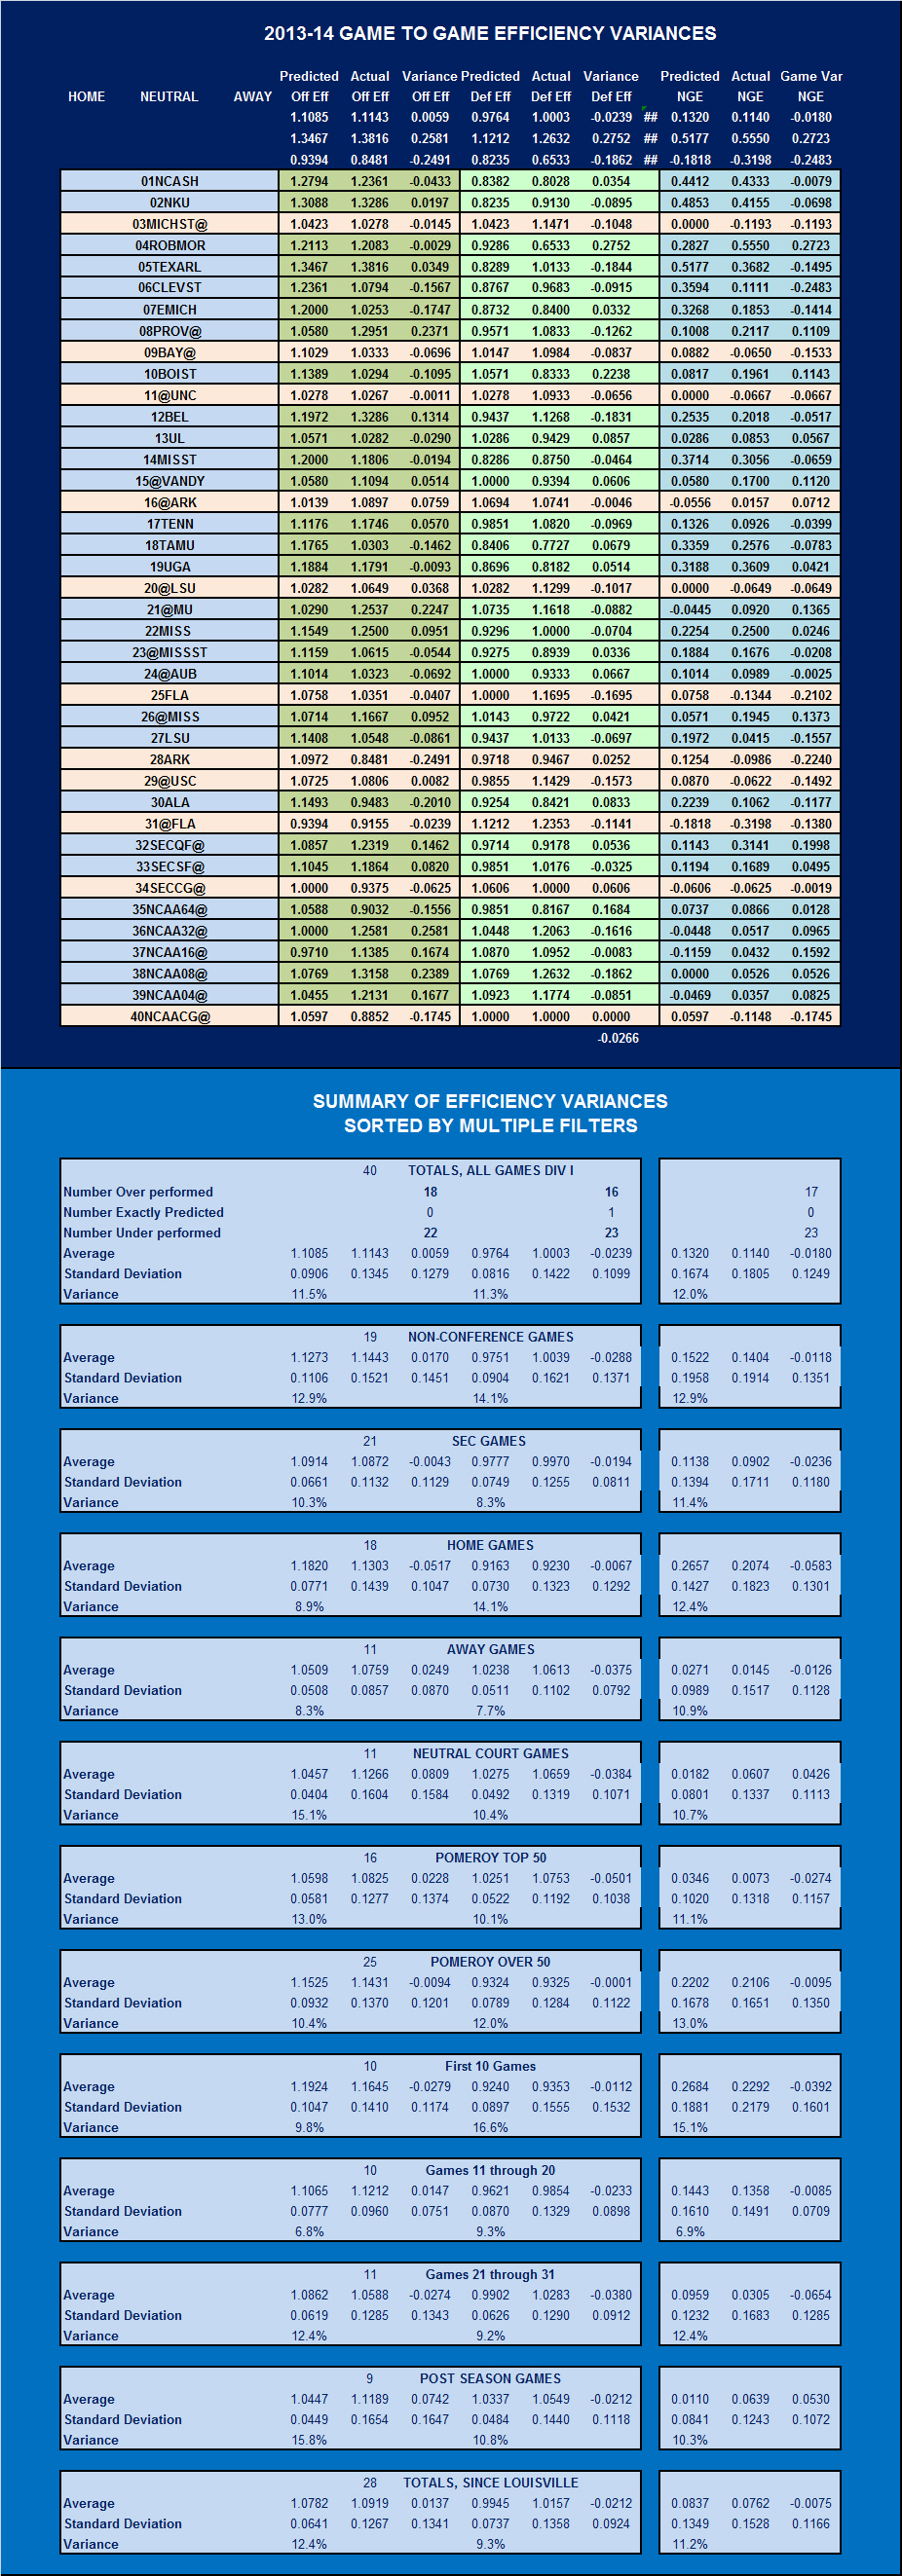
TABLE II
RESULTS FOR 2012-13
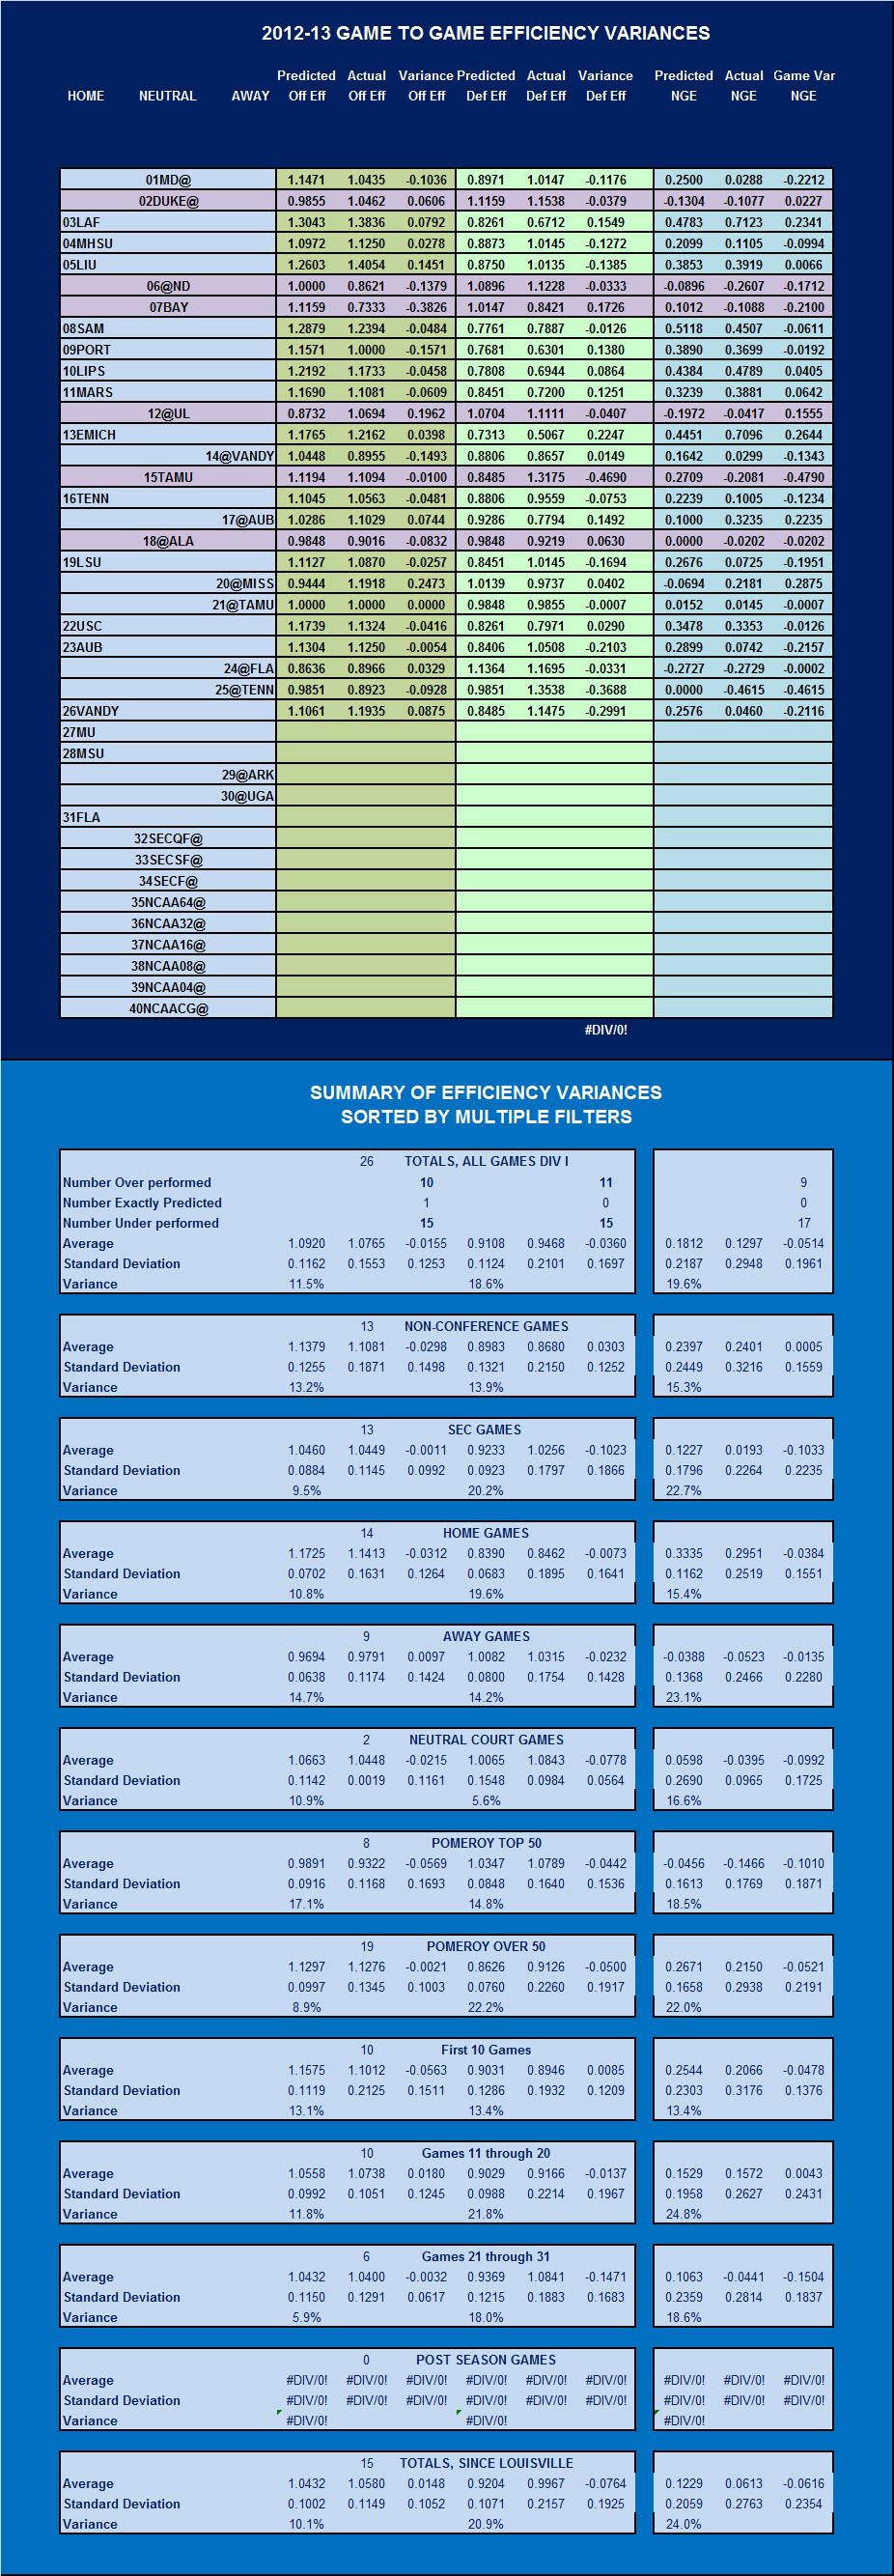
TABLE I
RESULTS FOR 2011-12
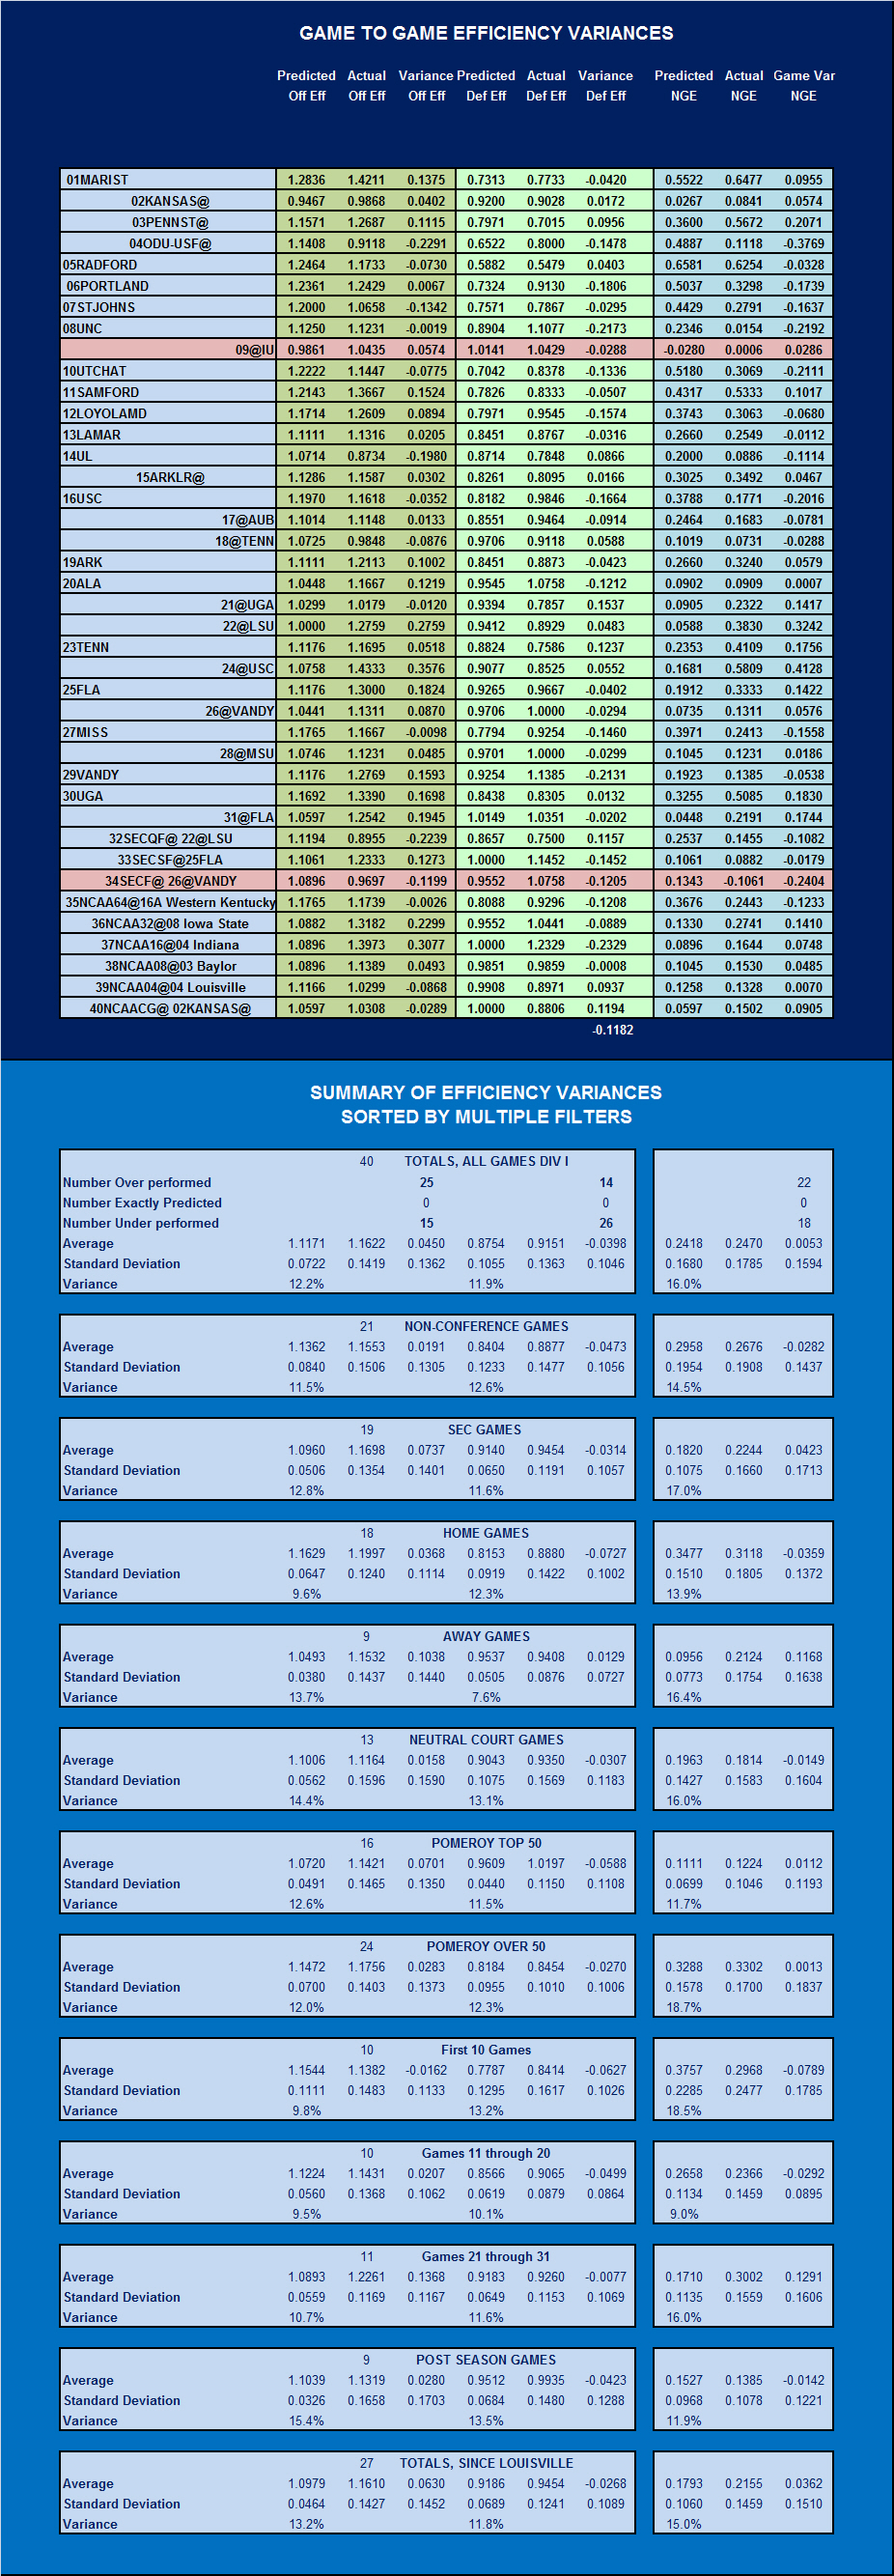
- All Games, Including Exhibitions
- All Games-D1 [No Exhibitions]
- Home
- Away
- Neutral Court
- Non-Conference
- SEC
- Pomeroy Top 50
- Pomeroy Over 50
- Post Season Play
- Games Since Louisville Game, 2003-2014
- SEC Tournament Gateway
- NCAA Tournament
You may link to any of these sorted data pages using the links above, or you can browse them in sequence using the "Continue" buttons at the bottom of each page.

To a Summary of All Seasons
1972 through 2015
IMPORTANT NOTE: In 2009-10, the Kentucky basketball team's rebounding became so dominant in the first 10 games that the differences created by a varied definition of a possession became substantial, and based on a 10 game comparison of predicted and actual results using the original definition and the Pomeroy definition, I have decided to start using the Pomeroy definition for a possession beginning with the 2009-10 season, and thereafter. However, I have no means to convert the data for all prior seasons to this new definition at this time. Therefore, any attempts to compare pace and efficiency derived values for 2009-10 and later with any prior season's posted values will fail. The differences are:
1. Pace values will be lower, by the number of offensive rebounds.
2. Efficiencies will be higher due to the lower number of total possessions
3. Turnover rates will be higher due to the lower number of possessions.
CHECK OUT THESE OTHER ANALYTICAL WRITINGS
What Is Basketball?
What is a Possession?
Change in Position on Definition of Possessions
What Is Net Game Efficiency?
Why Do "Upsets" Occur?
Do Objective Performance Measures Like NGE
Account For Intangible?
Go Back
Copyright 2008-15
SugarHill Communications of Kentucky
All Rights Reserve
Go Back
TABLE I
RESULTS TO DATE FOR 2010-11
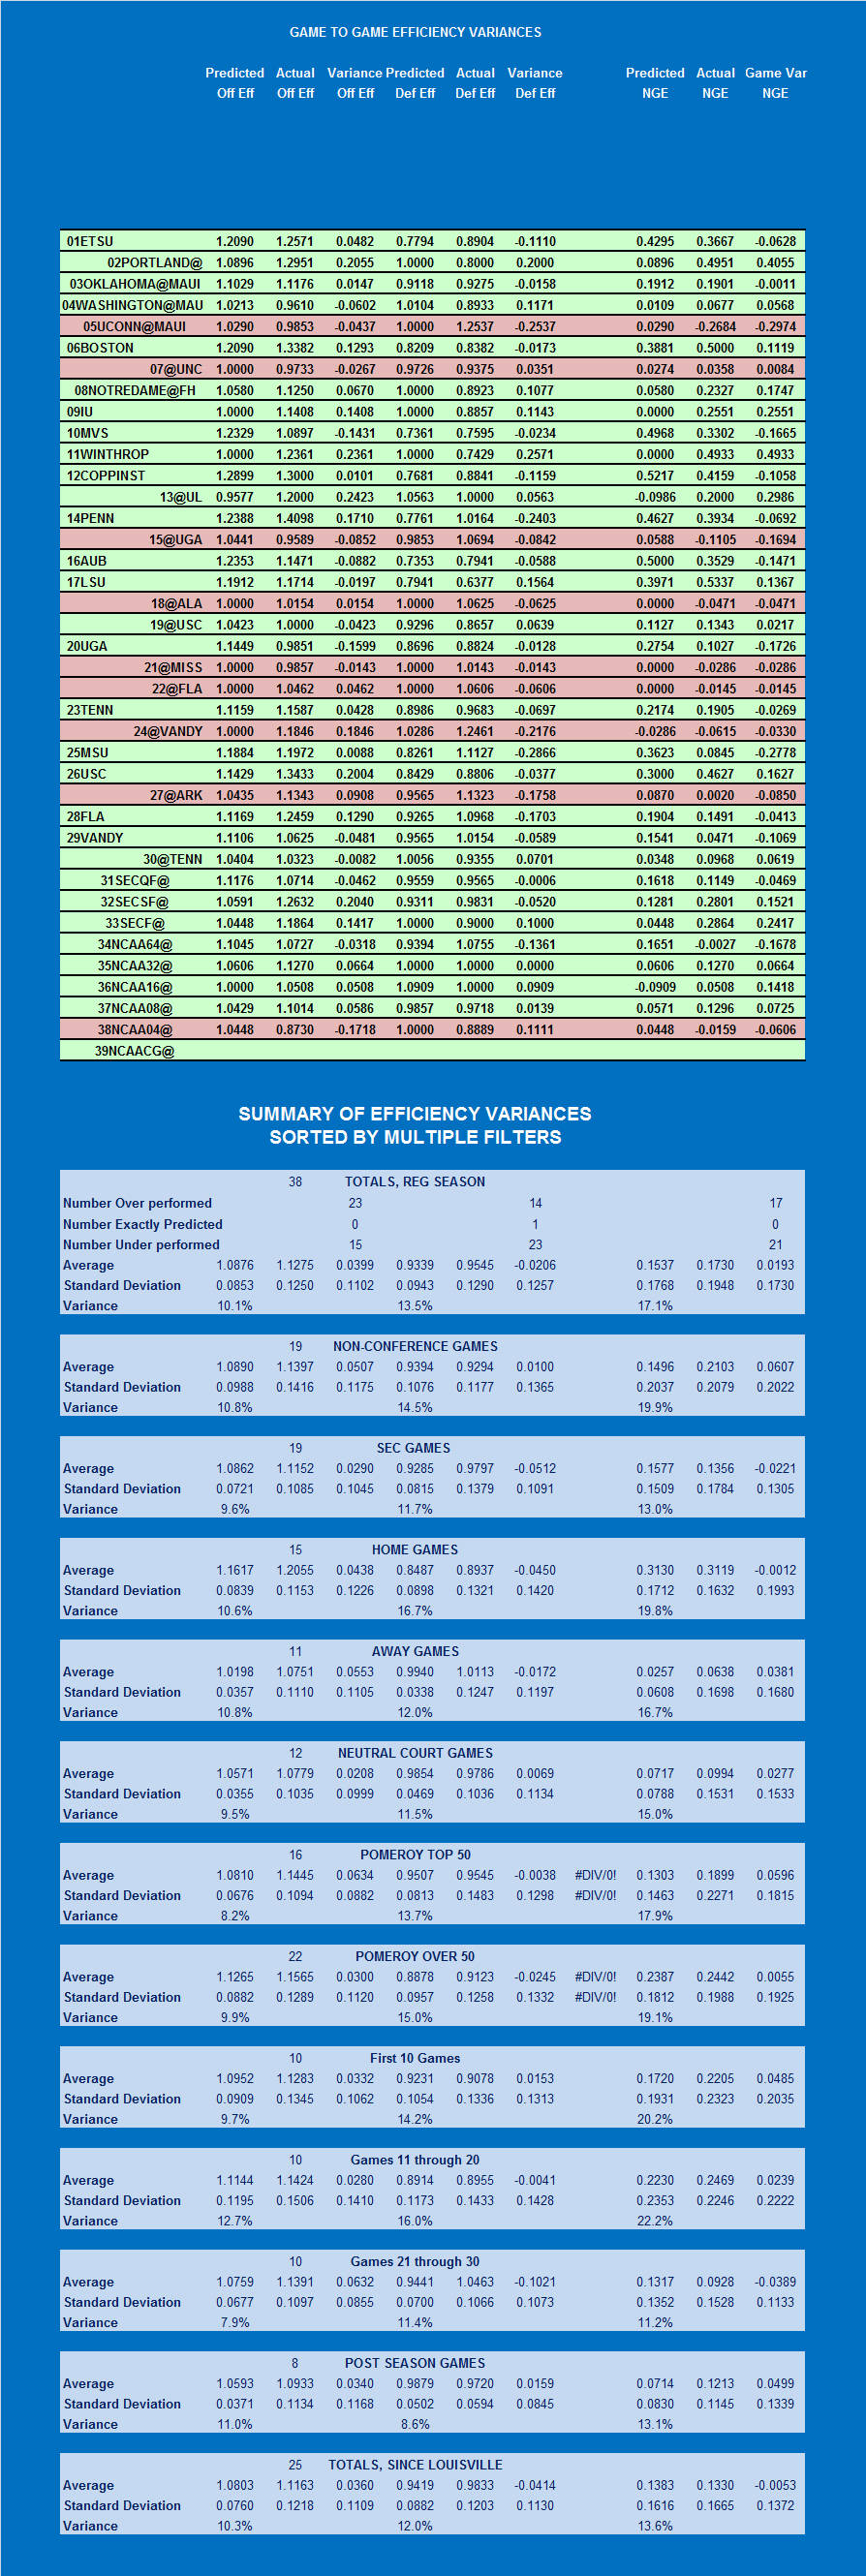
TABLE I-A
RESULTS TO DATE FOR 2009-10
To a Summary of All Seasons
1972 through 2011
-
- All Games, Including Exhibitions
- All Games-D1 [No Exhibitions]
- Home
- Away
- Neutral Court
- Non-Conference
- SEC
- Pomeroy Top 50
- Pomeroy Over 50
- Post Season Play
- Games Since Louisville Game, 2003-2014
- SEC Tournament Gateway
- NCAA Tournament
You may link to any of these sorted data pages using the links above, or you can browse them in sequence using the "Continue" buttons at the bottom of each page.
To a Summary of All Seasons
1972 through 2015
IMPORTANT NOTE: In 2009-10, the Kentucky basketball team's rebounding became so dominant in the first 10 games that the differences created by a varied definition of a possession became substantial, and based on a 10 game comparison of predicted and actual results using the original definition and the Pomeroy definition, I have decided to start using the Pomeroy definition for a possession beginning with the 2009-10 season, and thereafter. However, I have no means to convert the data for all prior seasons to this new definition at this time. Therefore, any attempts to compare pace and efficiency derived values for 2009-10 and later with any prior season's posted values will fail. The differences are:
1. Pace values will be lower, by the number of offensive rebounds.
2. Efficiencies will be higher due to the lower number of total possessions
3. Turnover rates will be higher due to the lower number of possessions.
CHECK OUT THESE OTHER ANALYTICAL WRITINGS
What Is Basketball?
What is a Possession?
Change in Position on Definition of Possessions
What Is Net Game Efficiency?
Why Do "Upsets" Occur?
Do Objective Performance Measures Like NGE
Account For Intangible?
Go Back
Copyright 2008-15
SugarHill Communications of Kentucky
All Rights Reserve
|