BIG BLUE FANS FOR
![]()
BASKETBALL
![]()
The NCAA Selection Committee placed the Cats into the South Region, and Kentucky will face Davidson in the first round. If the Cats advance, they will probably then encounter Arizona, followed by #1 Seed Virginia. If the Cats should manage to upset the #1 Seed and advance to the Elite 8, the Cats are likely to face either Cincinnati or Tennessee for their 4th meeting of the year.
The Cats finished the season with an ANE of 0.208 points per possession (ppp). However, the Cats have finished strong, and over their last 8 games (7-1), the Cats played at an average ANE of 0.319 ppp for those 8 games. The following Table provides the season ending ANE and the ANE for the last 8 games for each of Kentucky's potential South Regional opponents. In addition, the percentages above each opponent are the percentage of games that UK played well enough to beat this opponent for the entire season and the last 8 games.
| Last 8 Games | 87.5% | 75.0% | 50.0% | 62.5% | 62.5% | |
| Full Season | 52.9% | 50.0% | 17.6% | 23.5% | 35.3% | |
| Kentucky vs. | Davidson | Arizona | Virginia | Cincinnati | Tennessee | |
| Last 8 Games ANE | 0.319 | 0.180 | 0.213 | 0.323 | 0.286 | 0.239 |
| Full Season ANE | 0.208 | 0.164 | 0.201 | 0.325 | 0.289 | 0.235 |
Just as Kentucky has found its stride over the last 8 games, and played at a substantially higher level during the final 8 games, so have Davidson and Arizona. However, Kentucky's improved play represents an increase in the ANE of 0.111 ppp while Davidson's and Arizona's increases have been more modest, 0.024 ppp and 0.012 ppp respectively. Virginia, Cincinnati, and Tennessee have played their last 8 games at the same level of efficiency as they played their entire season.
On Sunday, in the SEC championship game, the Cats entered the game a 1 to 4 point underdog, and led most of the way in route to a 5 point win. The swing of 6 to 9 points (projected to actual) in my opinion is attributable to this season ending improvement, and the point swing corresponds to an ANE differential of between 0.094 ppp and 0.141 ppp, which is very consistent with the 0.111 ppp overall average improvement in the Cats' play at the end of the season.
DAVIDSON (First Round):
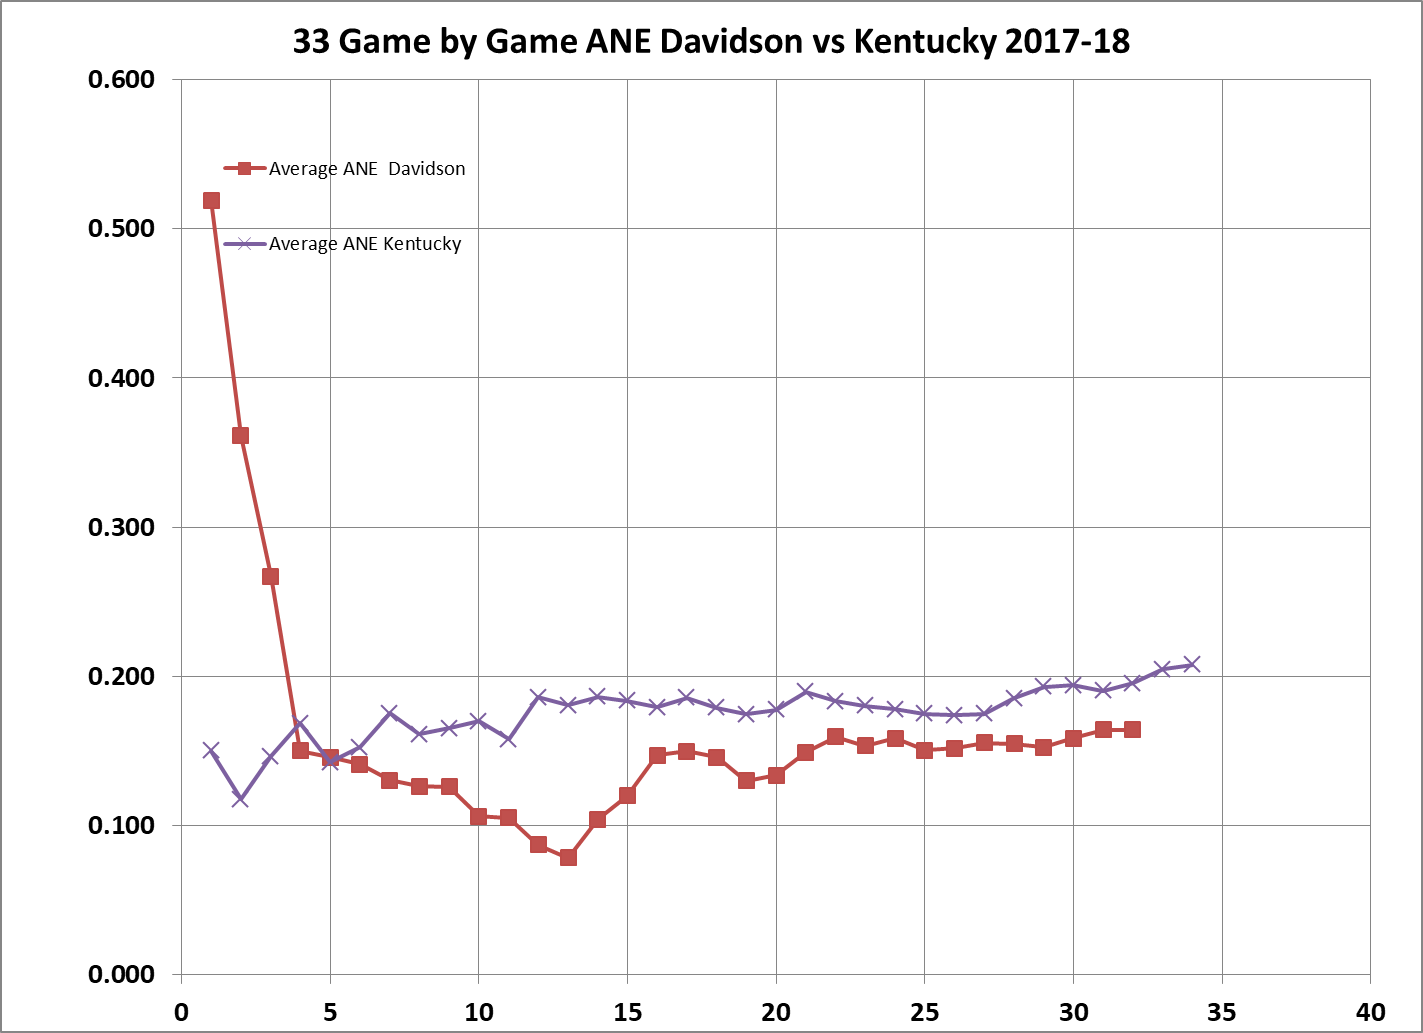
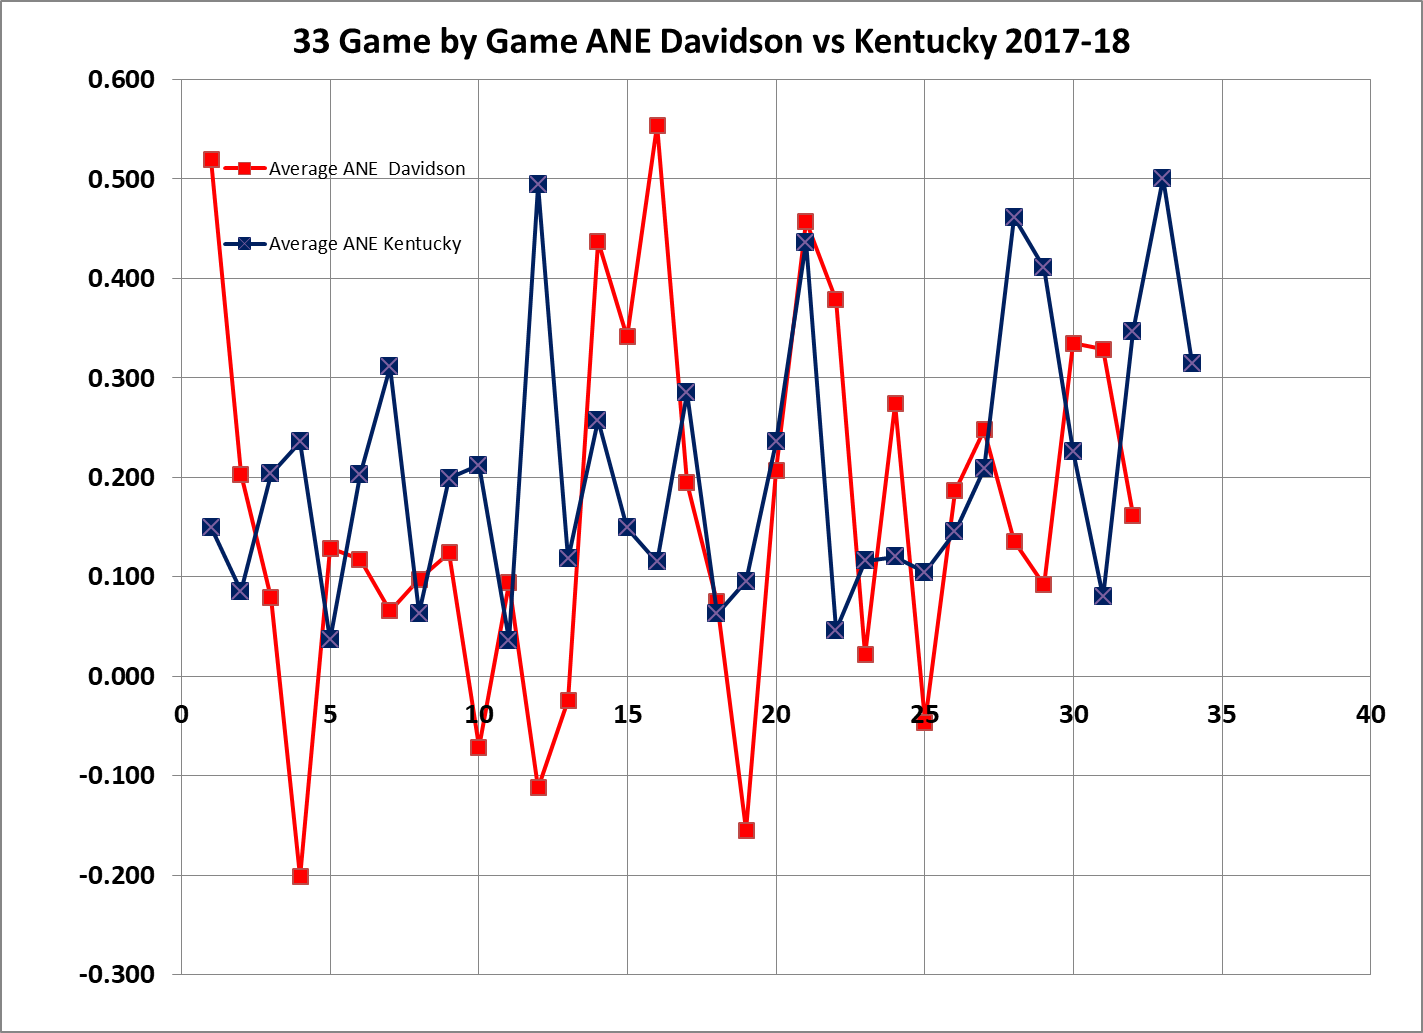
Based on season ending ANE values, the Cats played well enough to beat Davidson in 52.9% of their games this season. In contrast, Davidson only played 31% of its games well enough to beat the Cats this year. If we focus only on the last 8 games, the Cats played well enough to bead Davidson in 87.5% of the final 8 games, while Davidson only played well enough to beat the Cats 25% of the time over the last 8 games.
The traditional approach to set a game line indicates Kentucky is favored over Davidson by 3 to 4 points. Vegas opened with a line of Kentucky -6. However, if the data for the last 8 games are used, the line would be in the range of 9 points.
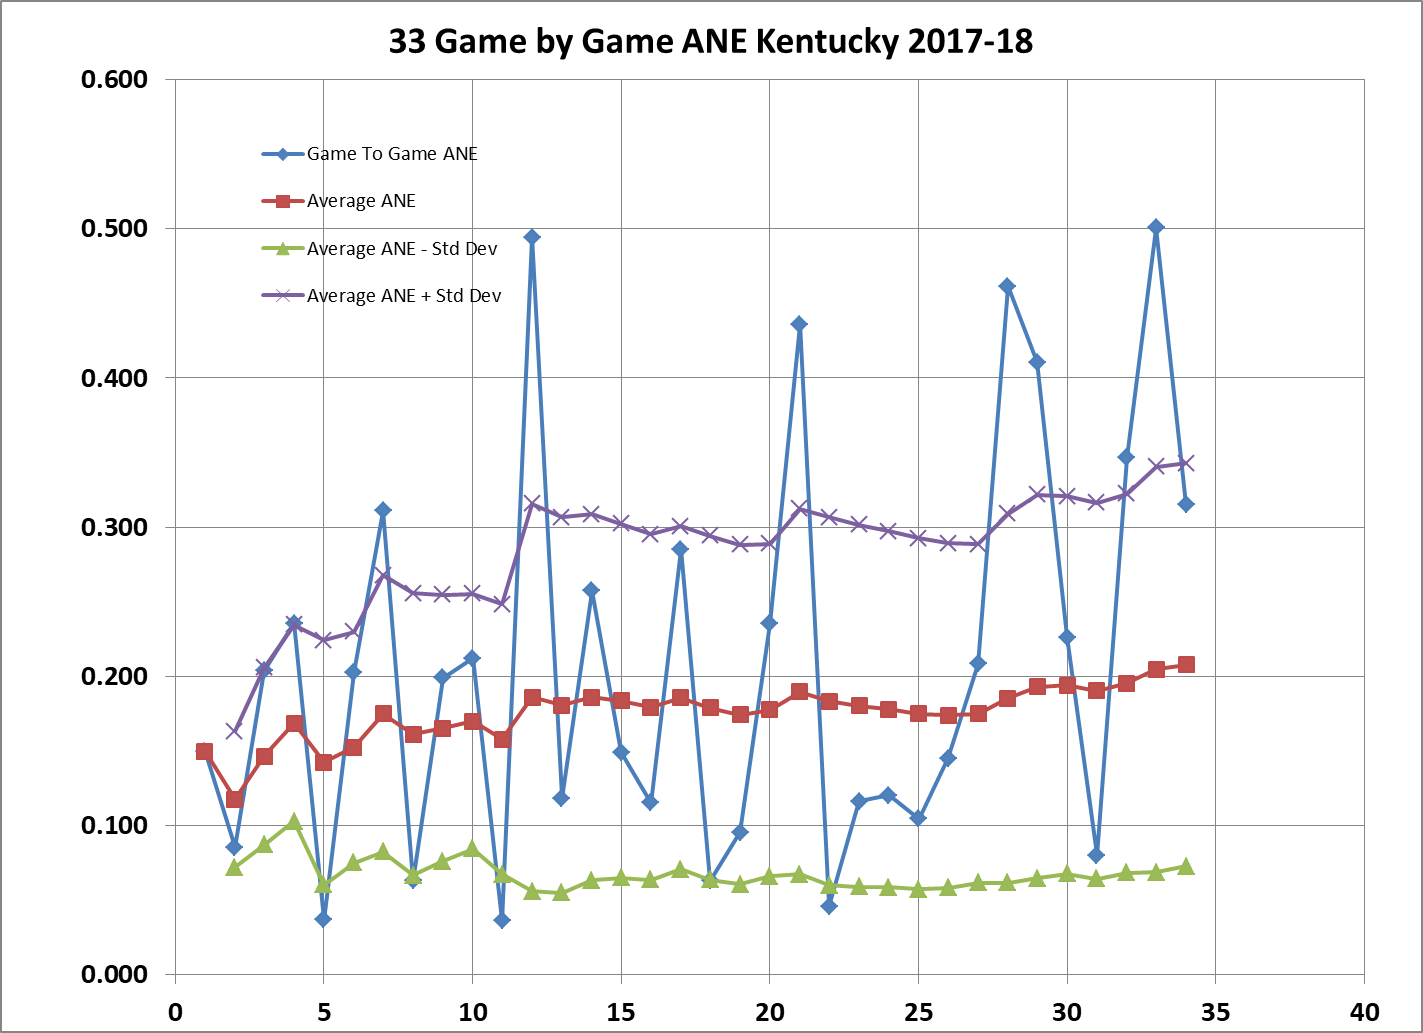
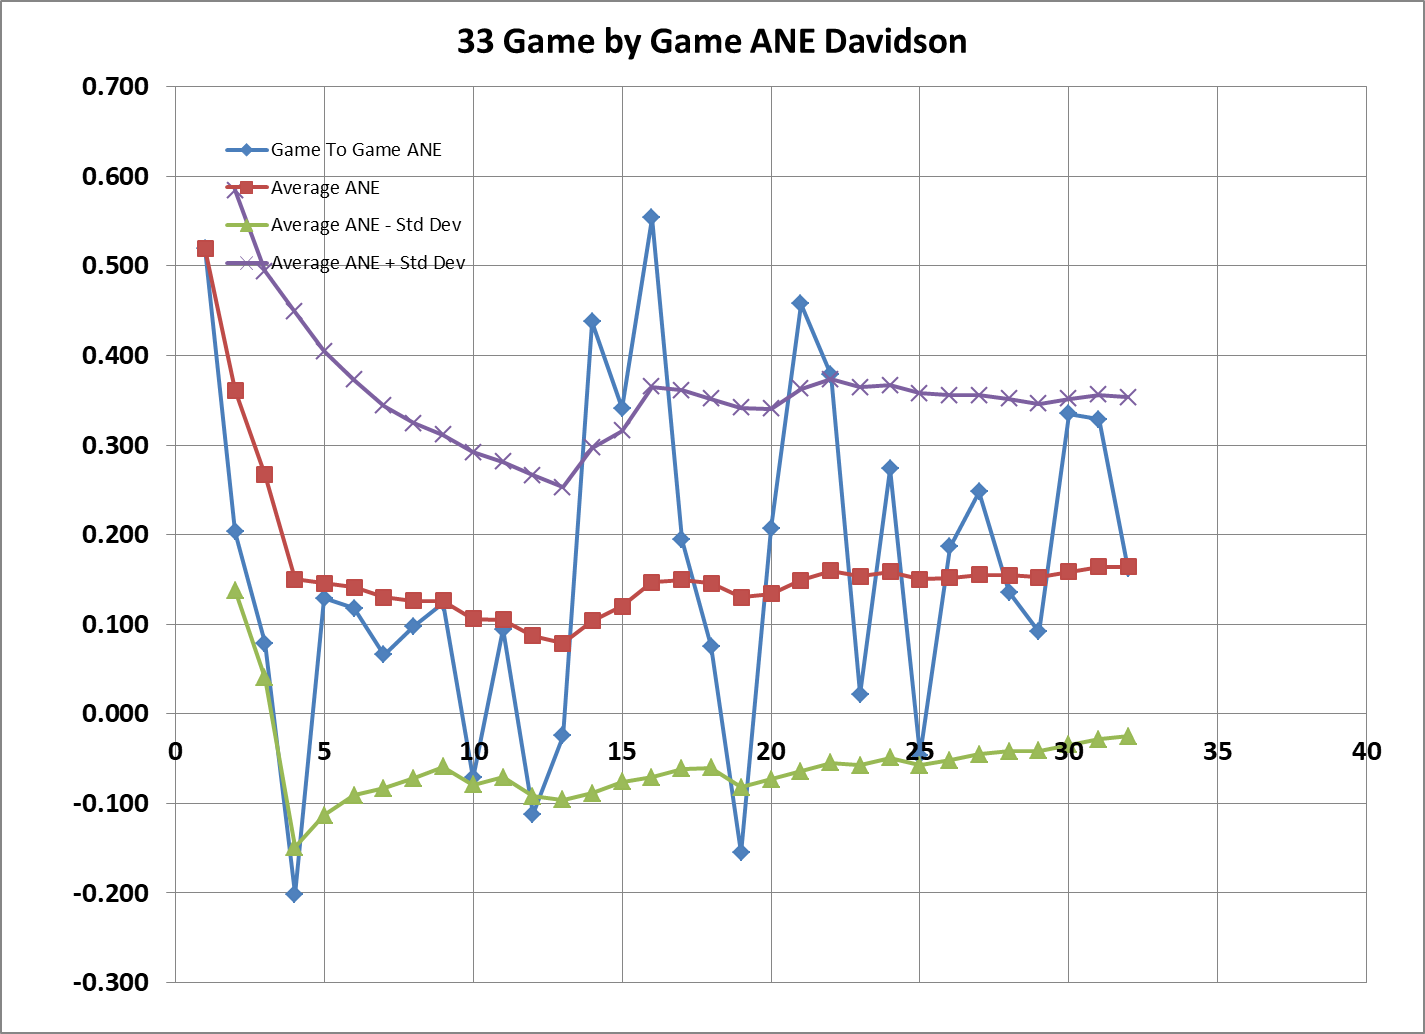
The following three graphs track Kentucky's game to game ANE, Davidson's game to game ANE, and a direct comparison of average ANE with Kentucky's average throughout the season.
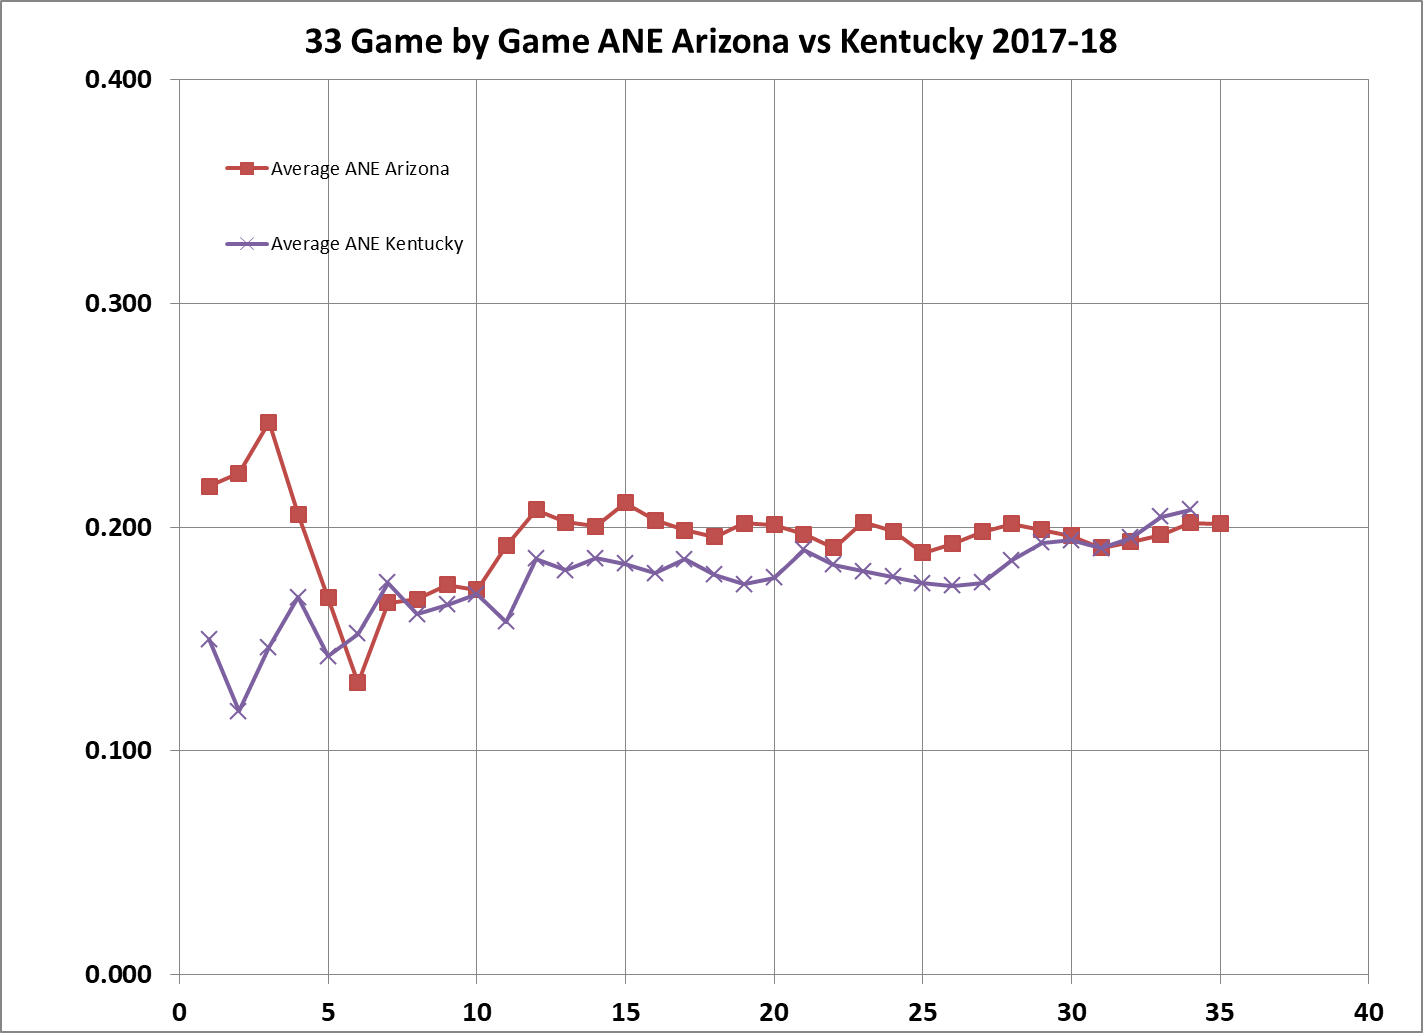
ARIZONA (Round 2):
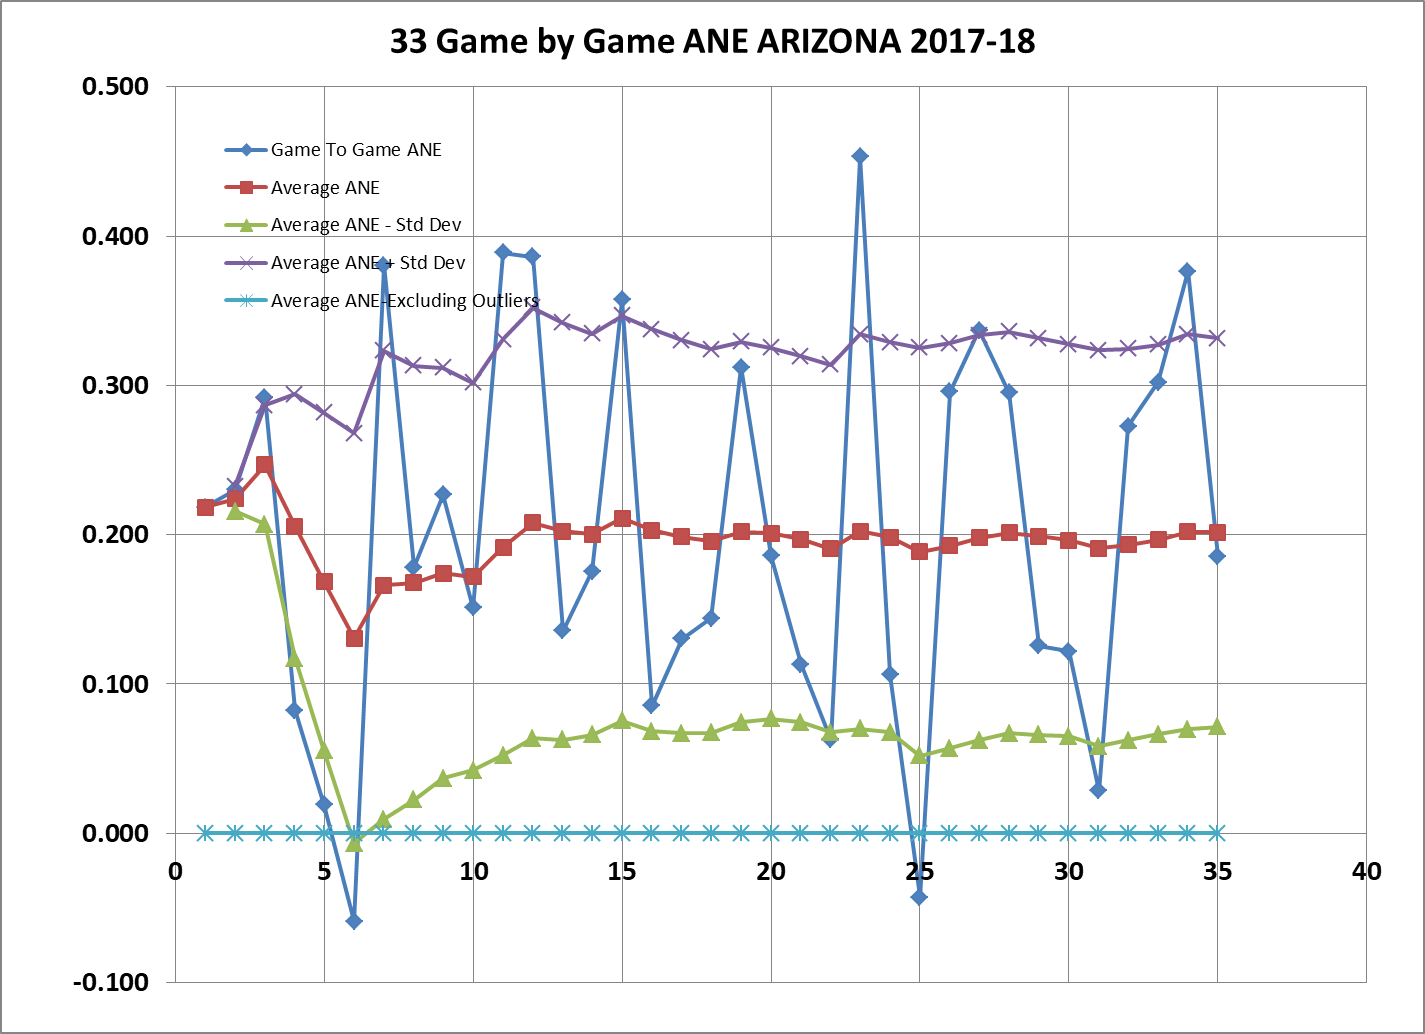
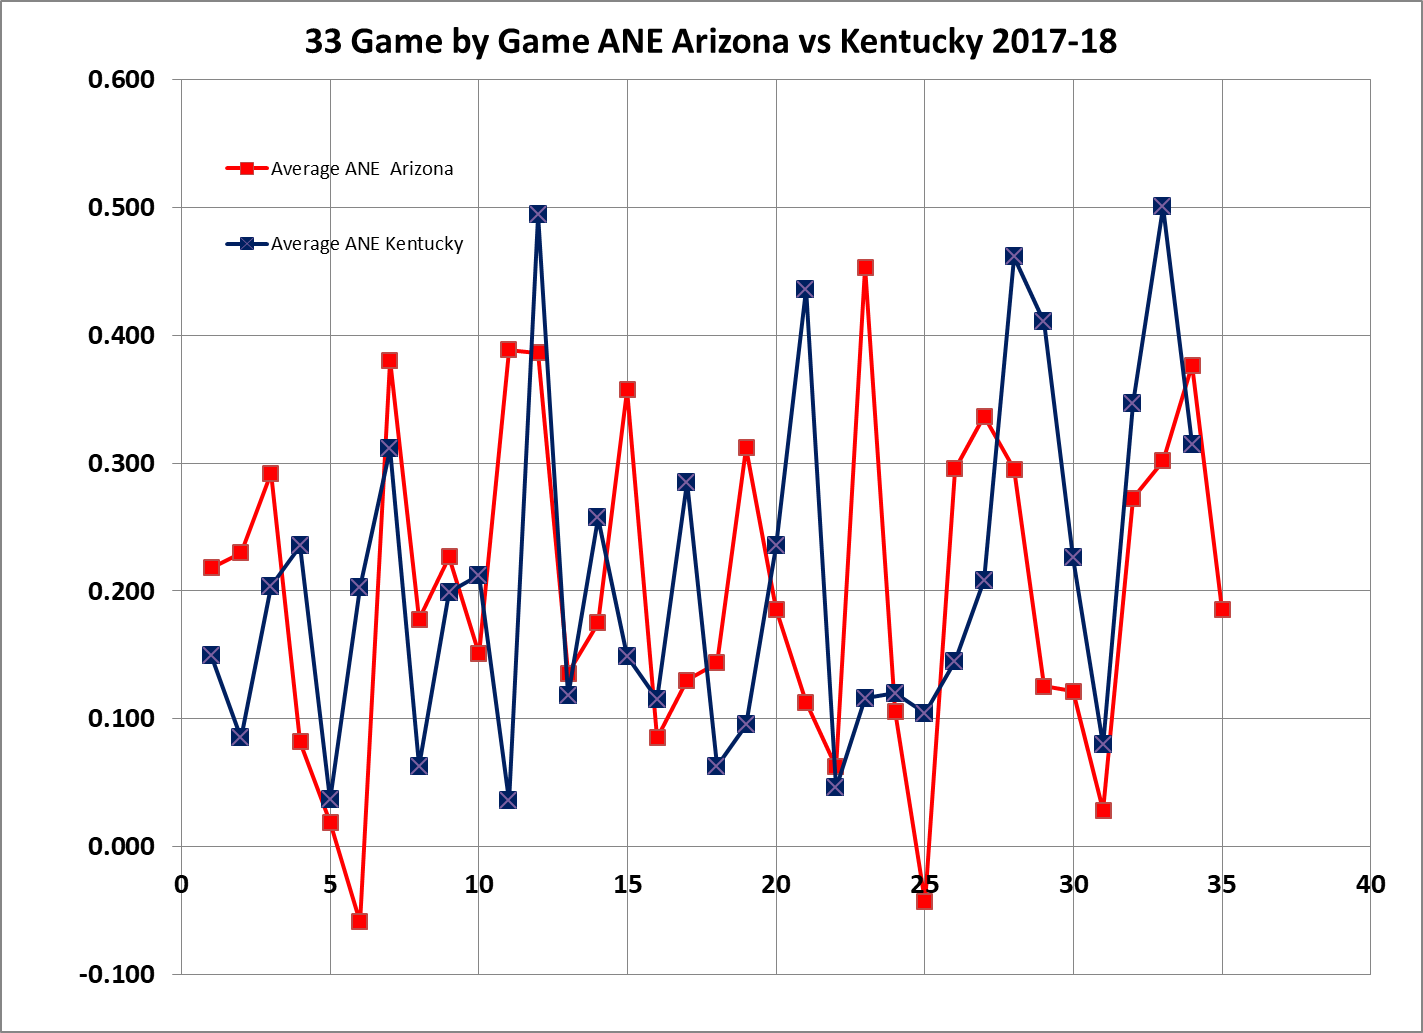
Should the Cats advance to the second round and face Arizona, the analysis is very similar. Based on season ending ANE values, the Cats played well enough to beat Arizona in 50.0% of their games this season. In contrast, Arizona only played 44% of its games well enough to beat the Cats this year. If we focus only on the last 8 games, the Cats played well enough to bead Arizona in 75.0% of the final 8 games, while Arizona only played well enough to beat the Cats12.5% of the time over the last 8 games.
The traditional approach to set a game line indicates Kentucky should be favored over Arizona by 1 point, and it could be a legitimate pick 'em game. However, if the data for the last 8 games are used, the line would be in Kentucky's favor by about 7 1/2 points.
The following two graphs track Arizona's game to game ANE, and a direct comparison of average ANE with Kentucky's average throughout the season.
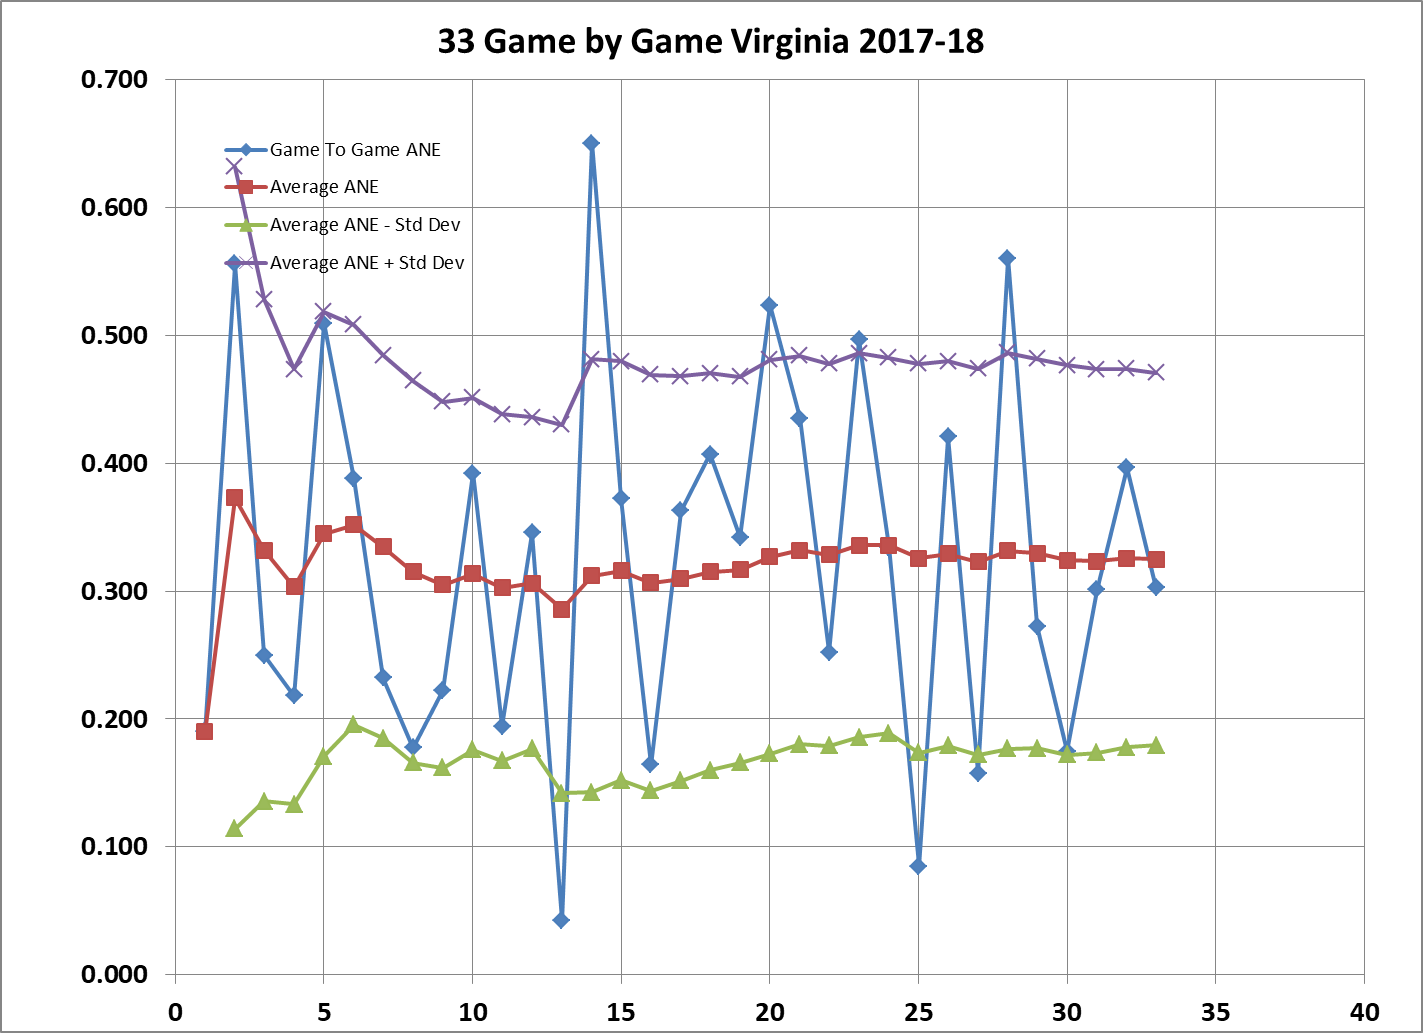
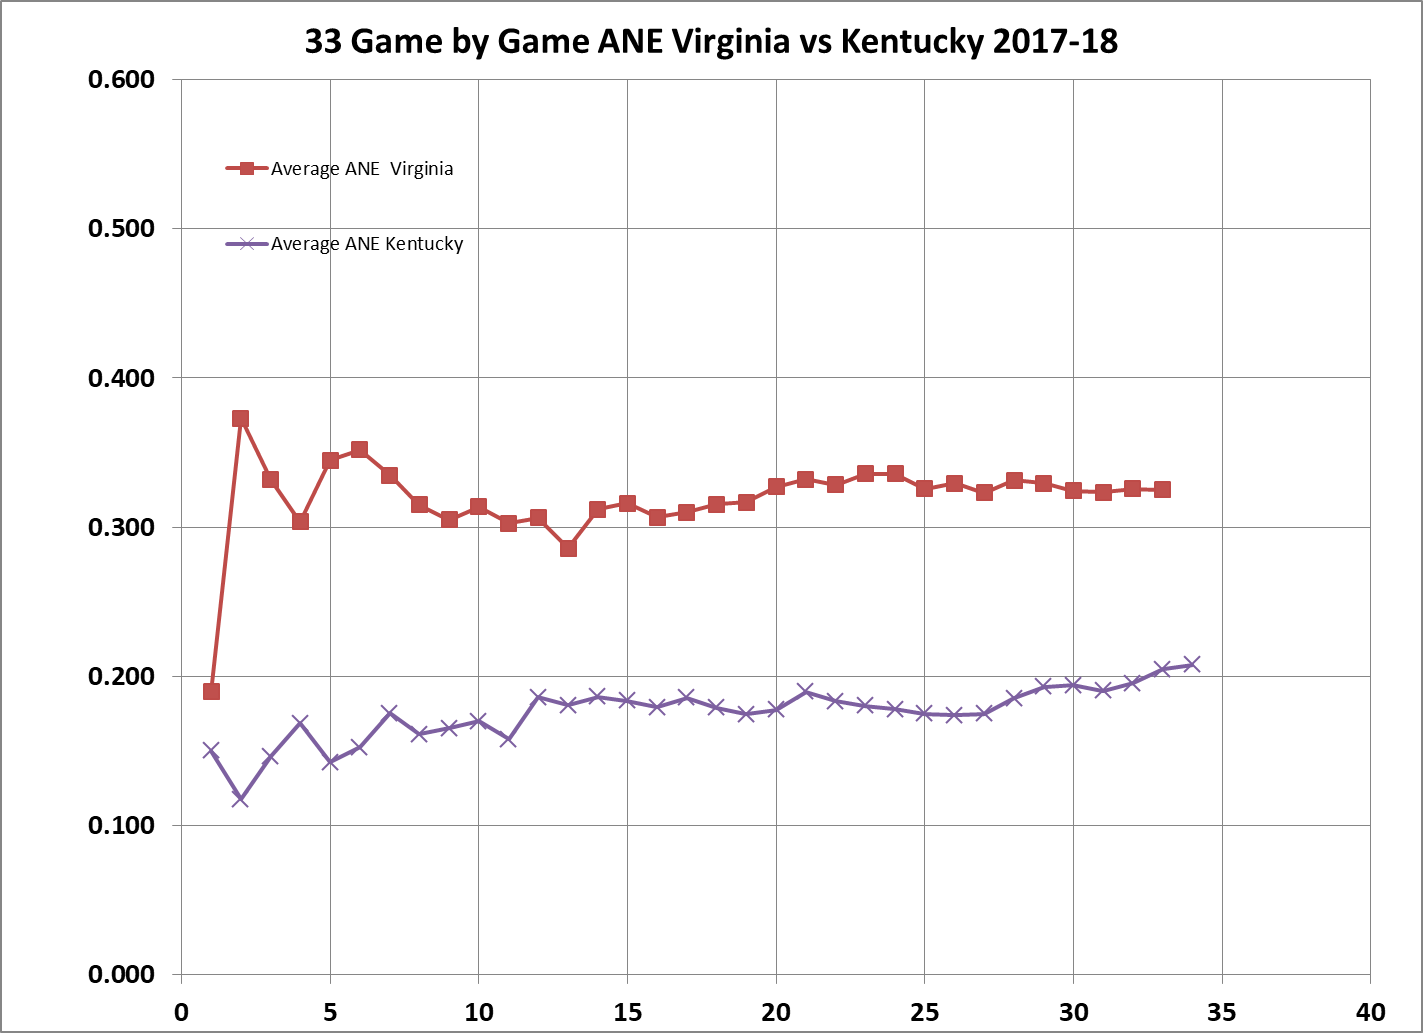
VIRGINIA (Sweet 16):
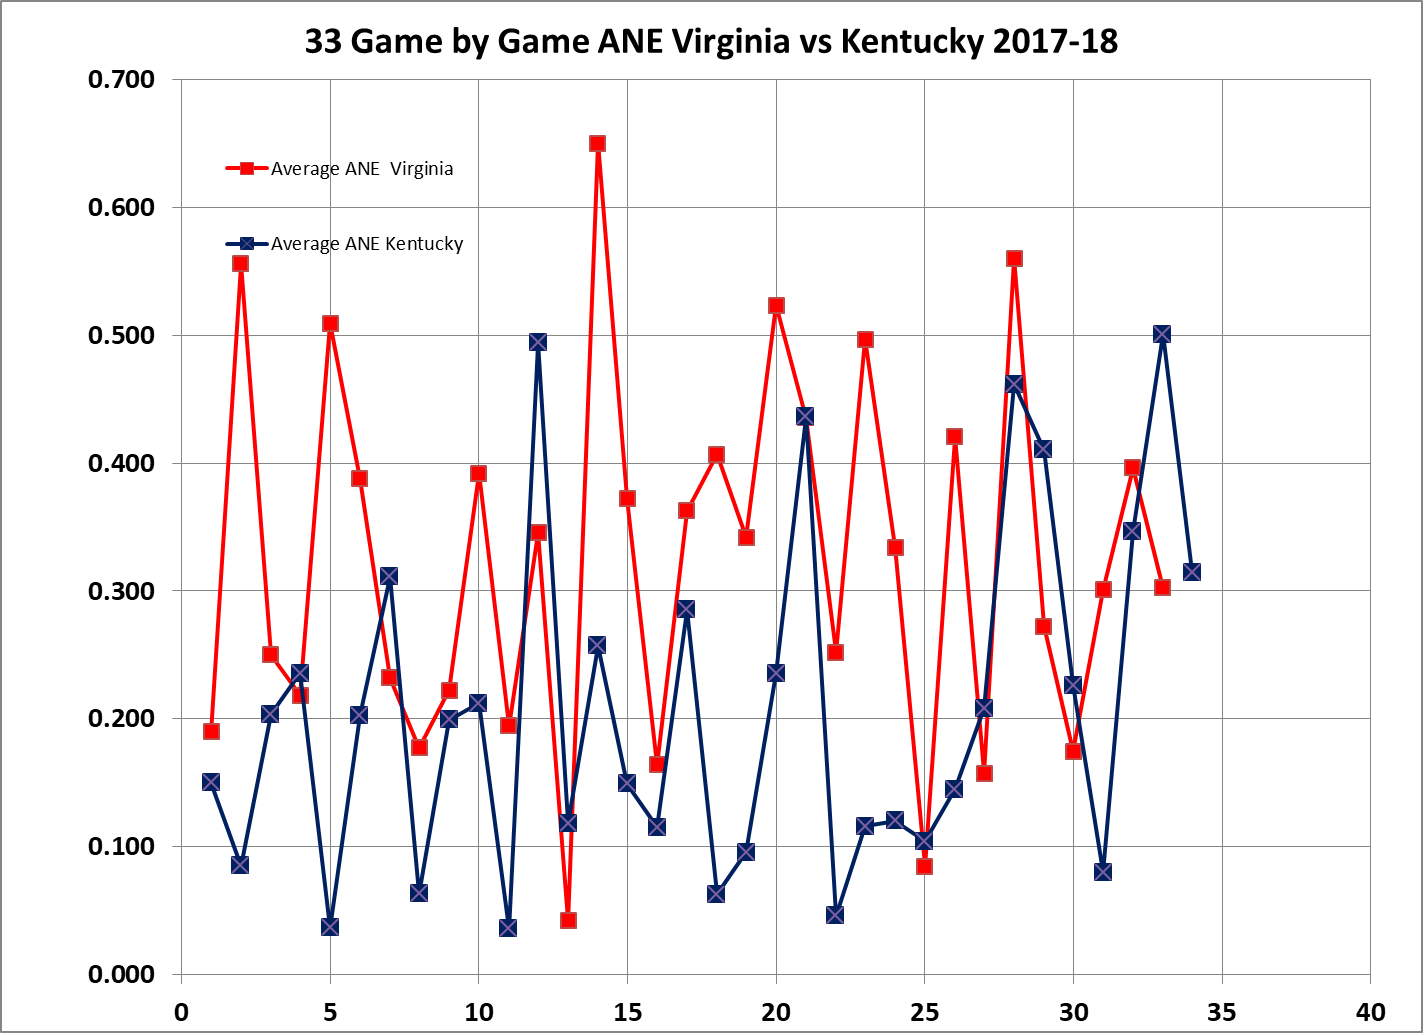
Should the Cats manage to advance to the Sweet 16, they are likely to face the Region's #1 Seed, Virginia. The analysis is similar, but the results vary from the previous two because Virginia is a legitimate #1 seed, carrying an ANE of 0.325 ppp into the tournament. Based on season ending ANE values, the Cats played well enough to beat Virginia in 17.6% of their games this season. In contrast, Virginia played 75% of its games well enough to beat the Cats this year. If we focus only on the last 8 games, the Cats played well enough to bead Virginia in 50.0% of the final 8 games, while Virginia only played well enough to beat the Cats 37.5% of the time over the last 8 games.
The traditional approach to set a game line indicates Virginia should be favored over the Cats by about 7 points. However, if the data for the last 8 games are used, the line would be in remain in Viriginia's favor by less than a point, and could be a legitimate pick 'em game.
The following two graphs track Virginia's game to game ANE, and a direct comparison of average ANE with Kentucky's average throughout the season.
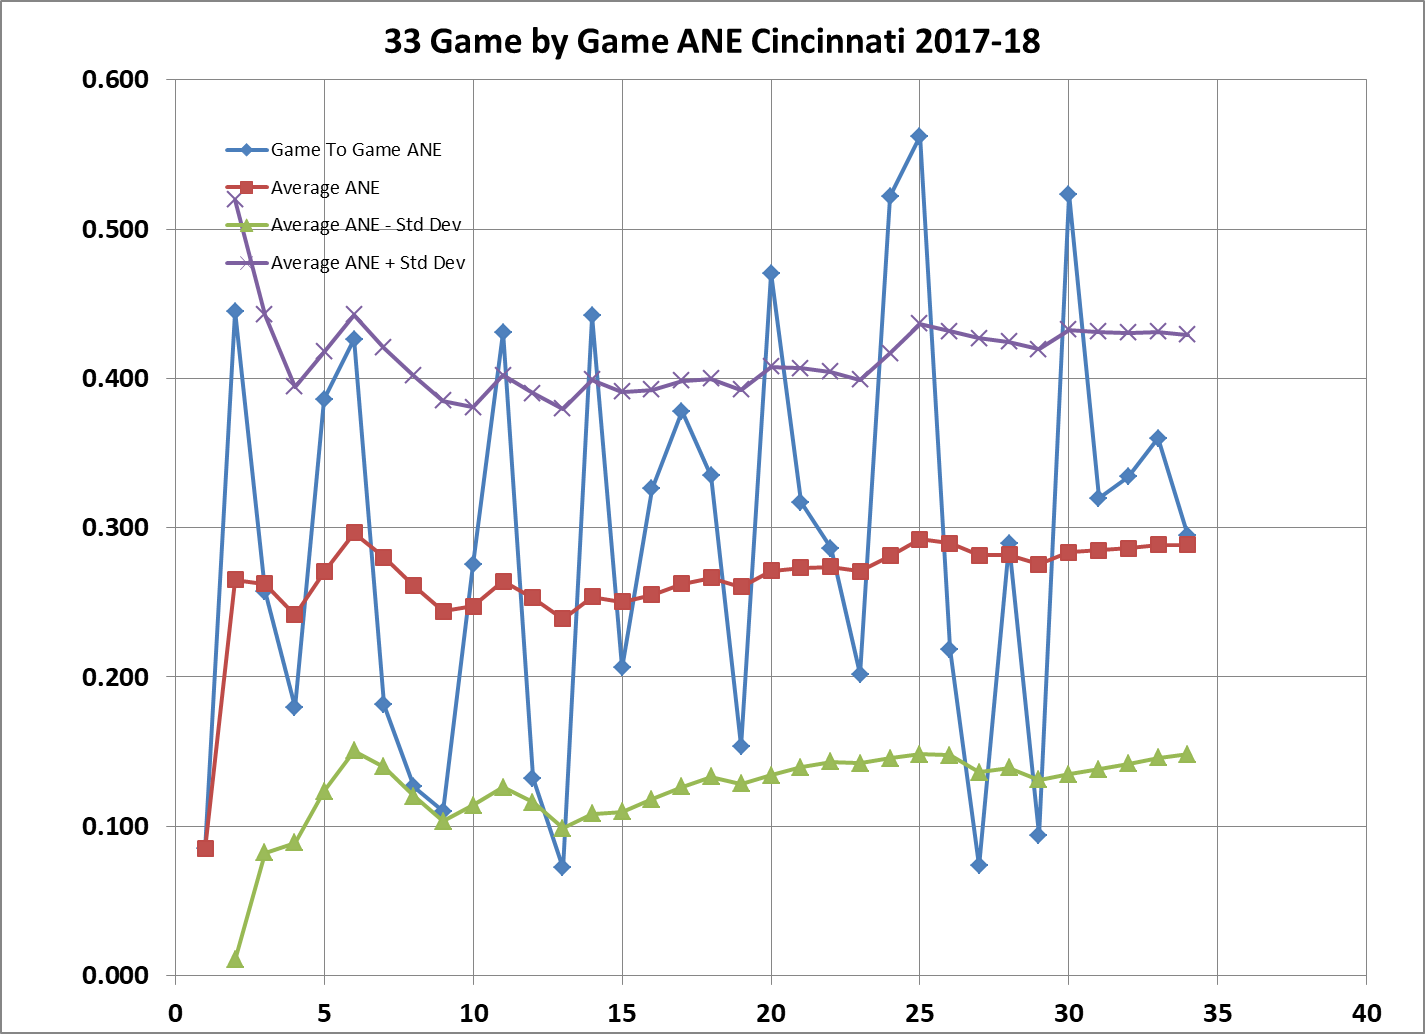
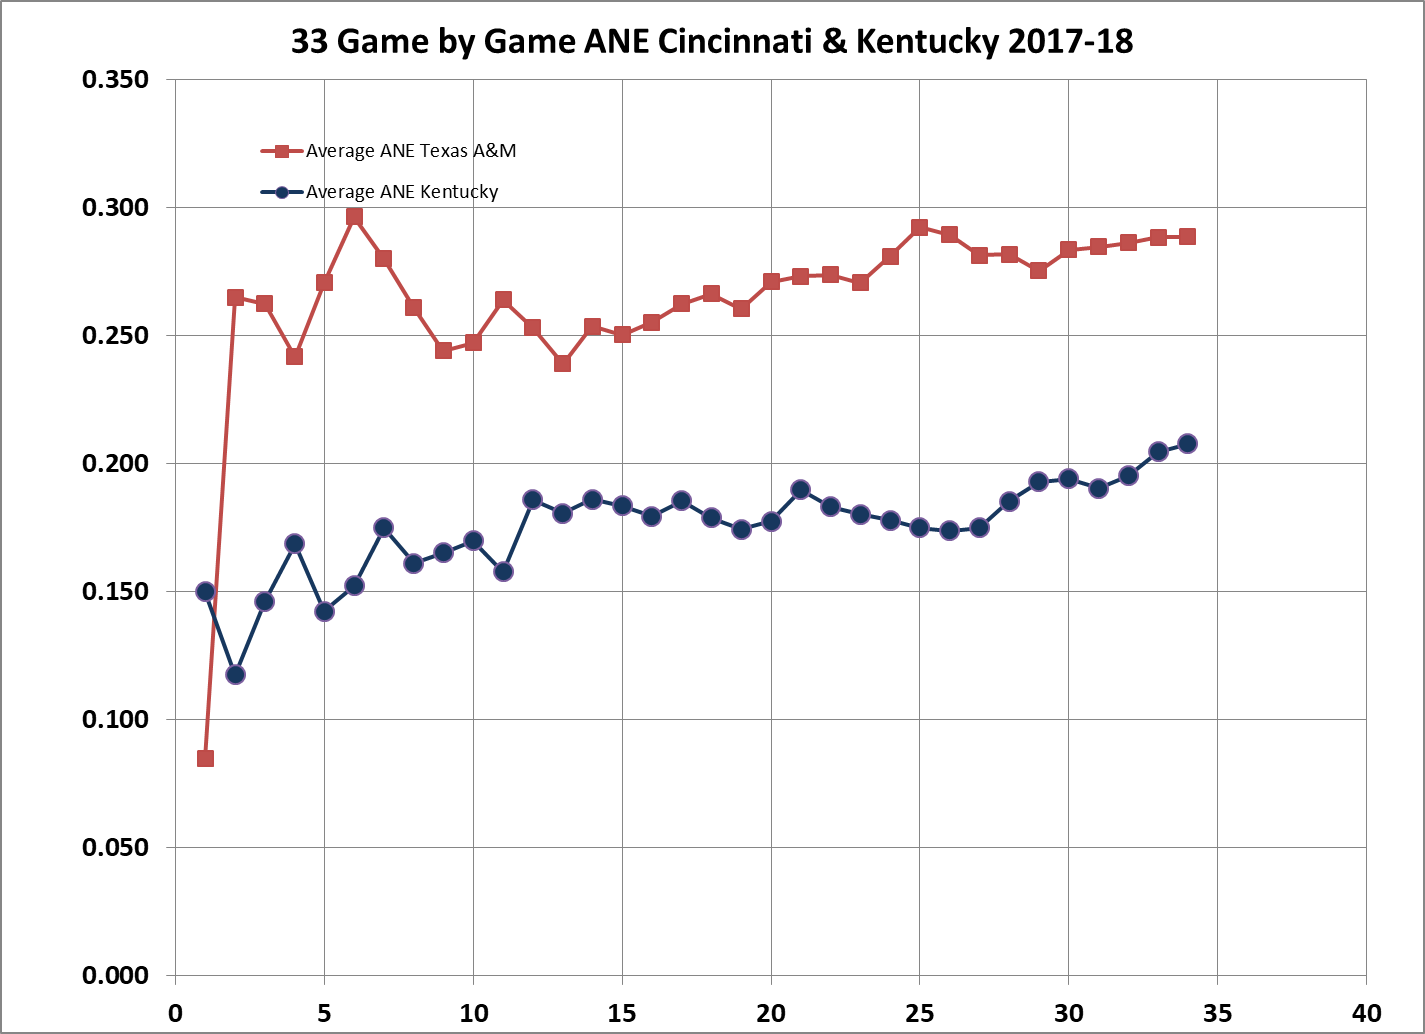
CINCINNATI (Elite 8):
Should the Cats manage to advance to the Elite 8, they are likely to face the Region's #2 Seed, Cincinnati or the Region's #3 Seed, Tennessee. Based on season ending ANE values, the Cats played well enough to beat Cincinnati in 23.5% of their games this season. In contrast, Cincinnati played 62.5% of its games well enough to beat the Cats this year. If we focus only on the last 8 games, the Cats played well enough to beat Cincinnati in 62.5% of the final 8 games, while Cincinnati only played well enough to beat the Cats 50.0% of the time over the last 8 games.
The traditional approach to set a game line indicates Cincinnati should be favored over the Cats by about 5 1/2 points. However, if the data for the last 8 games are used, the line would shift to the Cat's favor about 2 1/2 points.
The following two graphs track Cincinnati's game to game ANE, and a direct comparison of average ANE with Kentucky's average throughout the season.
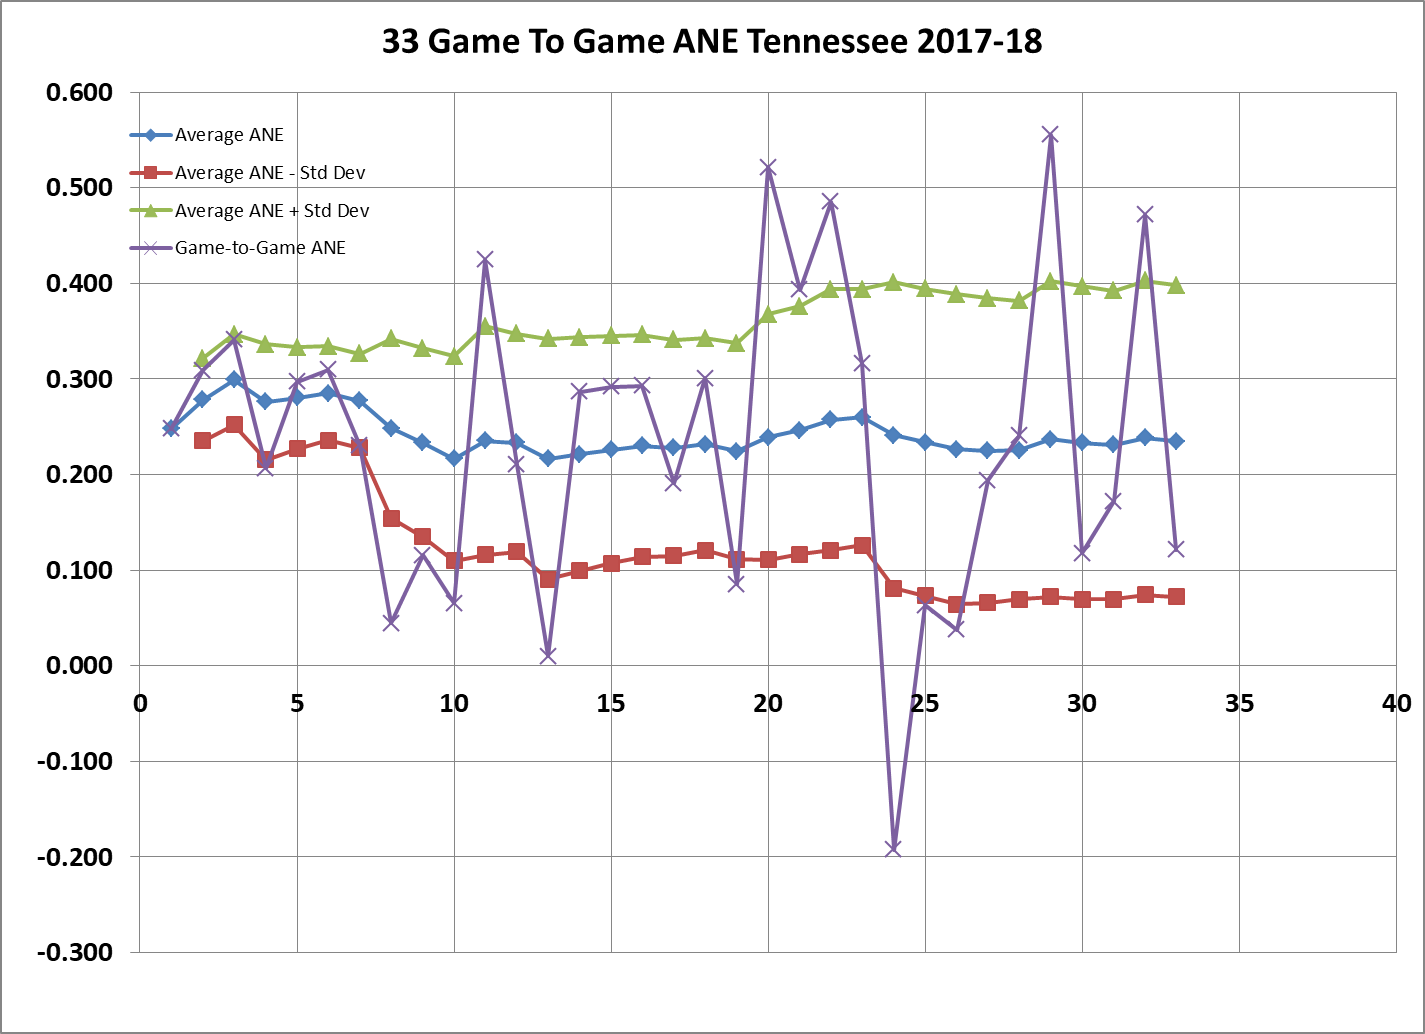
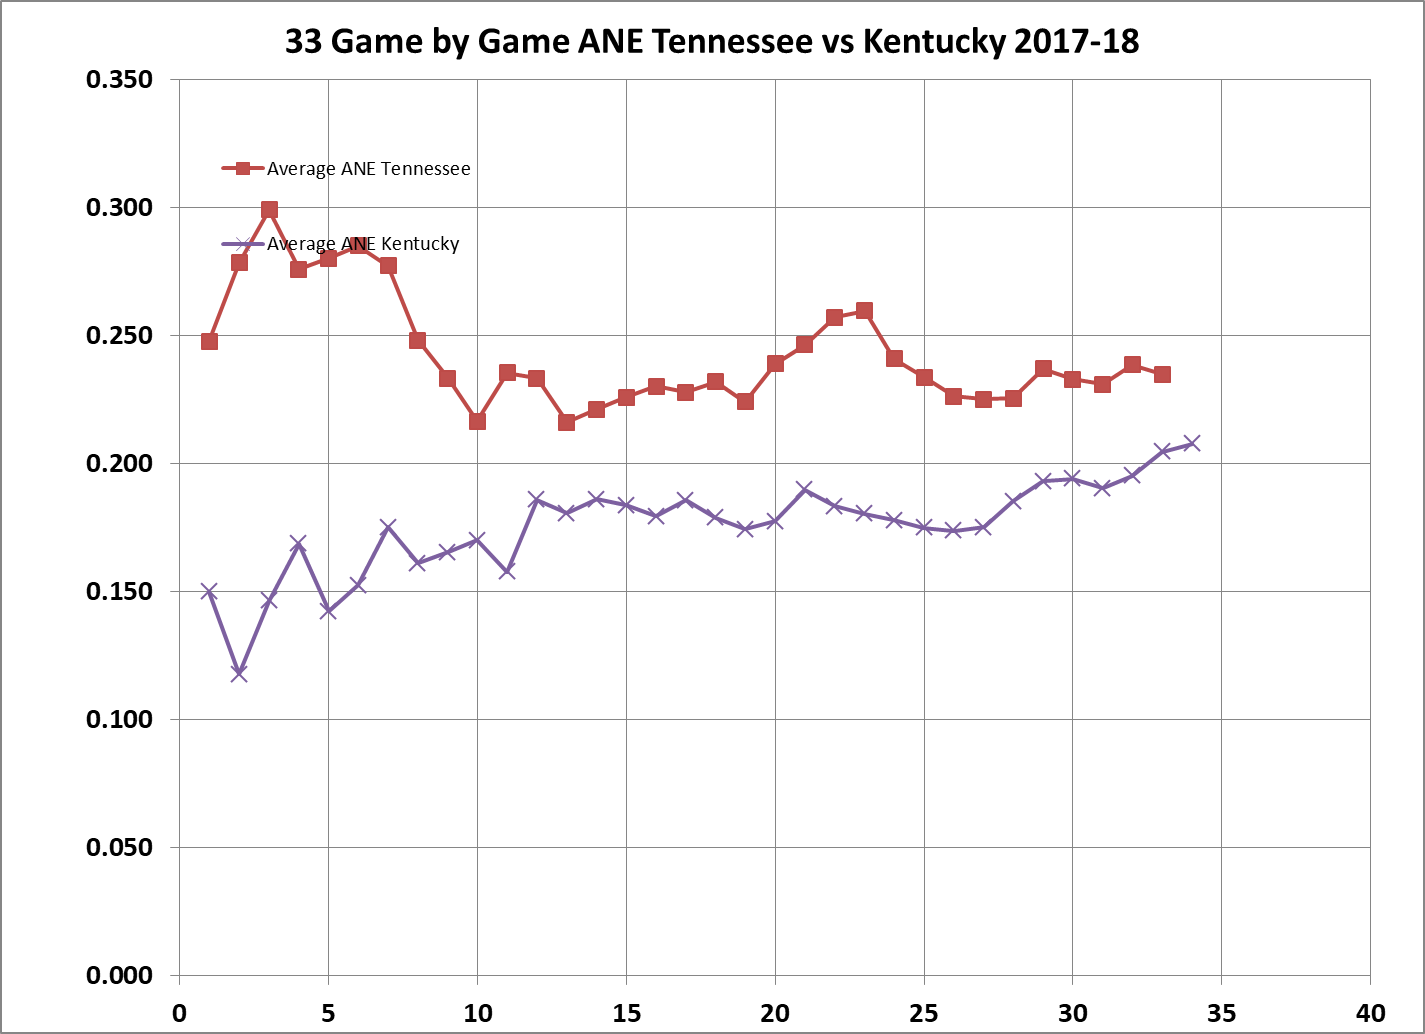
TENNESSEE (Alternative Elite 8):
Should the Cats manage to advance to the Elite 8, and Tennessee, the Region's #3 Seed, is the opponent, this will be the fourth encounter between the Cats and Vols this season, most recently on Sunday in the SEC Tournament's Championship game. As we observed prior to and after that game, an analysis based on season ending ANE values, the Vols would be about a 2 to 3 point favorite over the Cats. During the season, Kentucky played well enough to beat Tennessee in 35.3% of their games this season. In contrast, Tennessee played 59.4% of its games well enough to beat the Cats this year. If we focus only on the last 8 games, the Cats played well enough to beat Tennessee in 62.5% of the final 8 games, while Tennessee only played well enough to beat the Cats 25.0% of the time over the last 8 games.
The traditional approach to set a game line indicates Cincinnati should be favored over the Cats by about 2 to 3 points. However, if the data for the last 8 games are used, the line would shift to the Cat's favor about 5 1/2 points.
The following two graphs track Tennessee's game to game ANE, and a direct comparison of average ANE with Kentucky's average throughout the season.
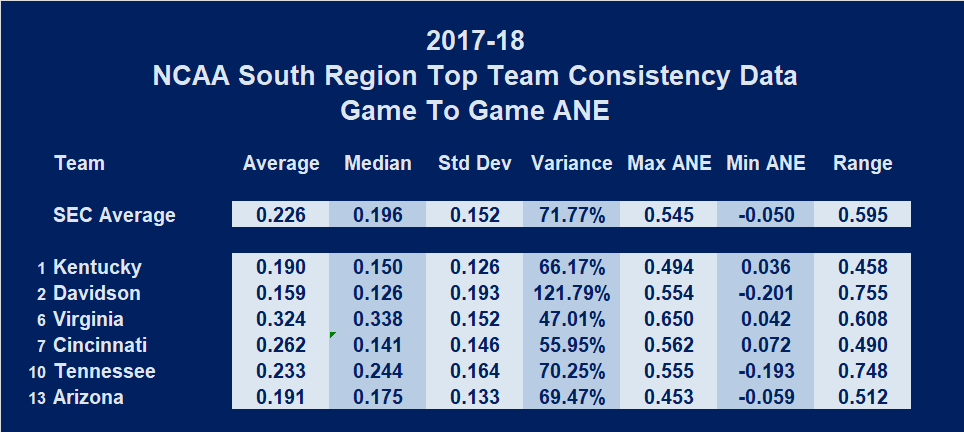
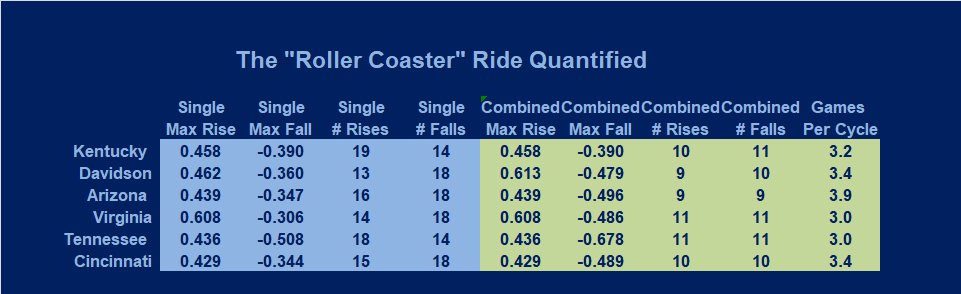
CONSISTENCY:
Kentucky has played more consistently than any of these other five potential opponents this season. Arizona has been the next most consistent, while Davidson has been the least consistent of this group.
The ride from start to finish is often compared to a roller coaster ride, with severe swings between the climbs to the peaks followed by the sudden, deep plunges to the depths. Some believe only their team experiences these wild swings of fortune. However, all teams experience this every season.
Davidson and Kentucky have had this type of ride this year. Which has had the wildest ride this season?
Arizona and Kentucky have had this type of ride this year. Which has had the wildest ride this season?
Virginia and Kentucky have had this type of ride this year. Which has had the wildest ride this season?
Every team rides the coaster from the start of the season to the end. Can the intensity of a team's ride be measured? Give this a try. This season, Kentucky had an increase in ANE from the prior game 19 times, and a decrease in ANE 14 times. The maximum single game rise has been 0.458 ppp and the maximum single game fall has been -0.390 ppp. When consecutive falls or rises are factored in, Kentucky experienced 10 1/2 cycles on its ride spanning 34 games, and the maximum climb or fall for a given cycle are the same as the single game rise and fall noted previously. Kentucky ended the season with a declining game, beginning its 11th cycle of the season. In the 10 previous down cycles, one has been 3 consecutive games, one has been 2 consecutive games, and eight were single game declines. The probabilities indicate Kentucky is due to have a rise in its next game.
Compare UK's "roller-coaster" ride to Davidson's for this season, and you will find a more intense ride by the Wildcats that wear red uniforms. This season, Davidson had an increase in ANE from the prior game 13 times, and a decrease in ANE 18 times. The maximum single game rise has been 0.462 ppp and the maximum single game fall has been -0.360 ppp. When consecutive falls or rises are factored in, Davidson experienced 9 1/2 cycles on its ride spanning 32 games, and the maximum climb increases to 0.613 ppp and the maximum fall for a given cycle increases to -0.479 ppp. Davidson enters the Kentucky game on a two game down cycle, its 10th cycle of the season. Twice this season, Davidson has had 3 consecutive down games, and three times their down cycle ended after two games. That means Davidson has had four single game falls. The probabilities indicate that Davidson is due to have a rise in its next game.
While it is possible for both teams to reverse their current downward leg of the cycle with a Kentucky win, it is not likely that both Kentucky and Davidson can reverse their current downward trends. To reverse its current downward trend, Kentucky must out perform its last game's 0.315 ppp, which requires a win over Davidson by about 10 points or more. Similarly, to reverse its losing trend, Davidson must out perform its last game's 0.162 ppp, which requires a Kentucky win of 1 point or a Davidson win. Therefore, the loser of this game is likely to end its season with a continuation of its current slide. Kentucky, on the other hand can win this game despite a continuation of its slippage, which would build momentum for a rise in performance in its next game, probably against Arizona.
If the Cats advance to the second round, I will amend this analysis for the next opponent, probably Arizona.
I will leave it to the reader to examine the nature of Arizona's, Virginia's, Tennessee's, and Cincinnati's roller coaster rides in 2017-18.
1. Pace values will be lower, by the number of offensive rebounds.
2. Efficiencies will be higher due to the lower number of total possessions
3. Turnover rates will be higher due to the lower number of possessions.
CHECK OUT THESE OTHER ANALYTICAL WRITINGS
Change in Position on Definition of Possessions
Do Objective Performance Measures Like NGE
Account For Intangible?
Here is an example Possible ANE Based Seeding for 2017
Copyright 2008-18
SugarHill Communications of Kentucky
All Rights Reserve