BIG BLUE FANS FOR
![]()
BASKETBALL
![]()
Kentucky's Third NCAA Tournament Opponent
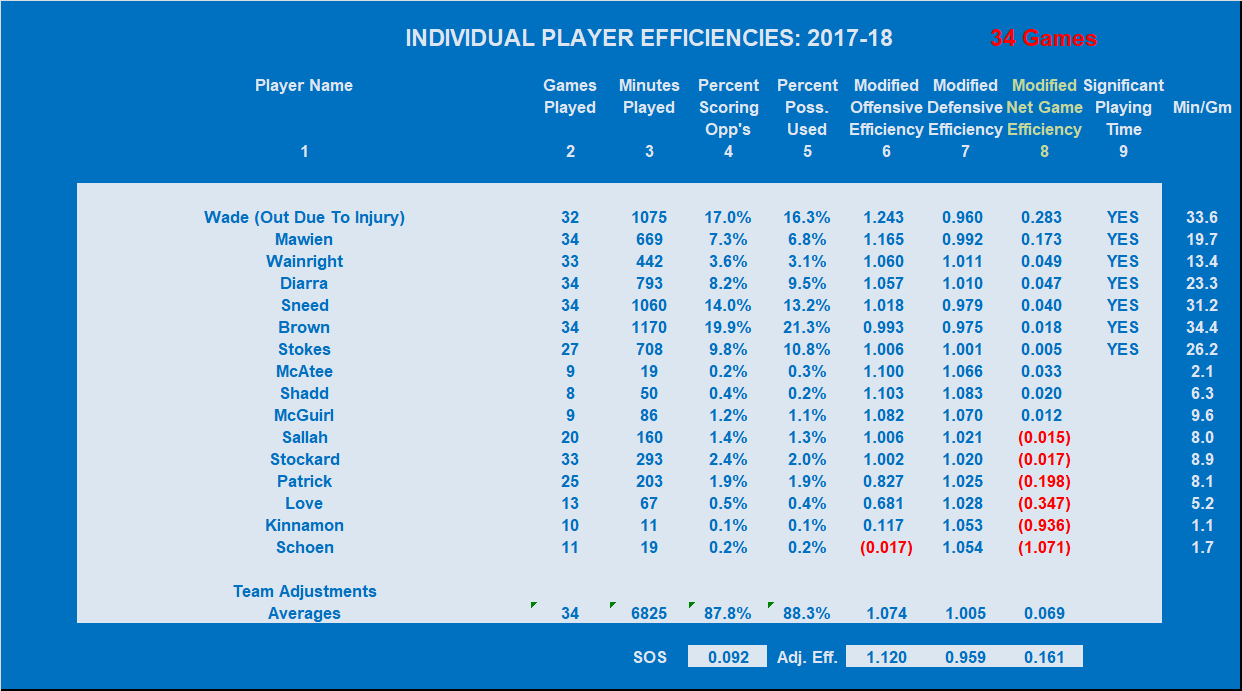
is Kansas State
Kansas State
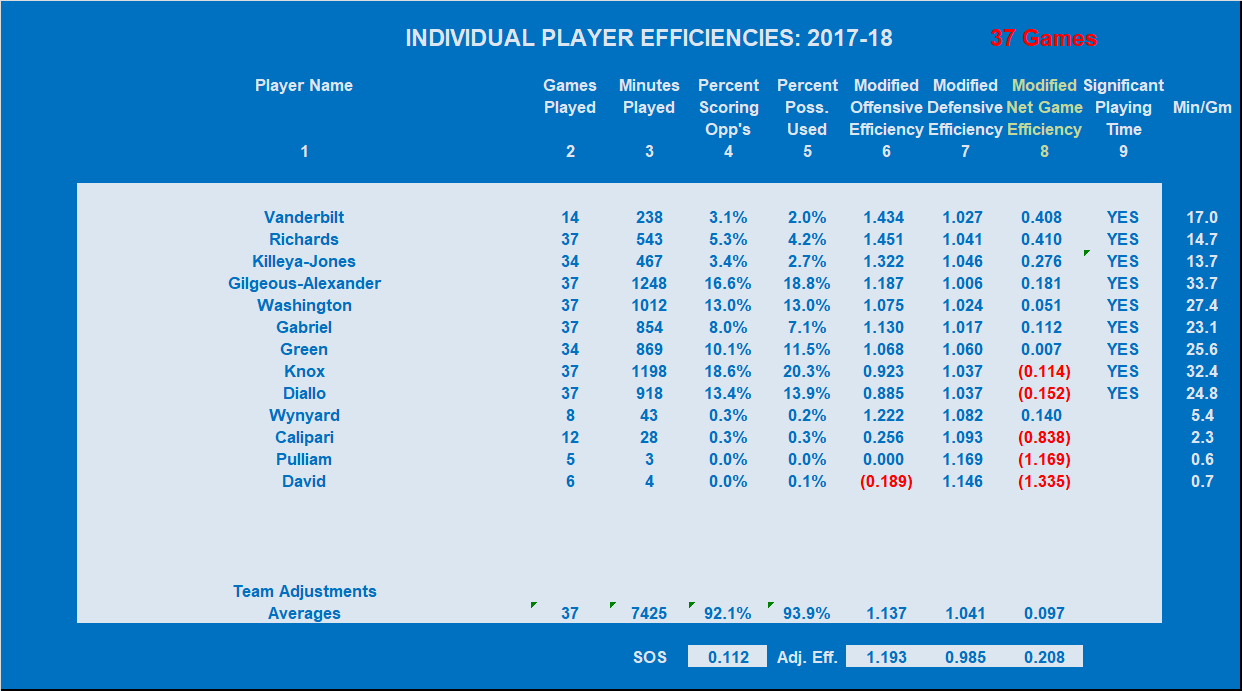
Kentucky
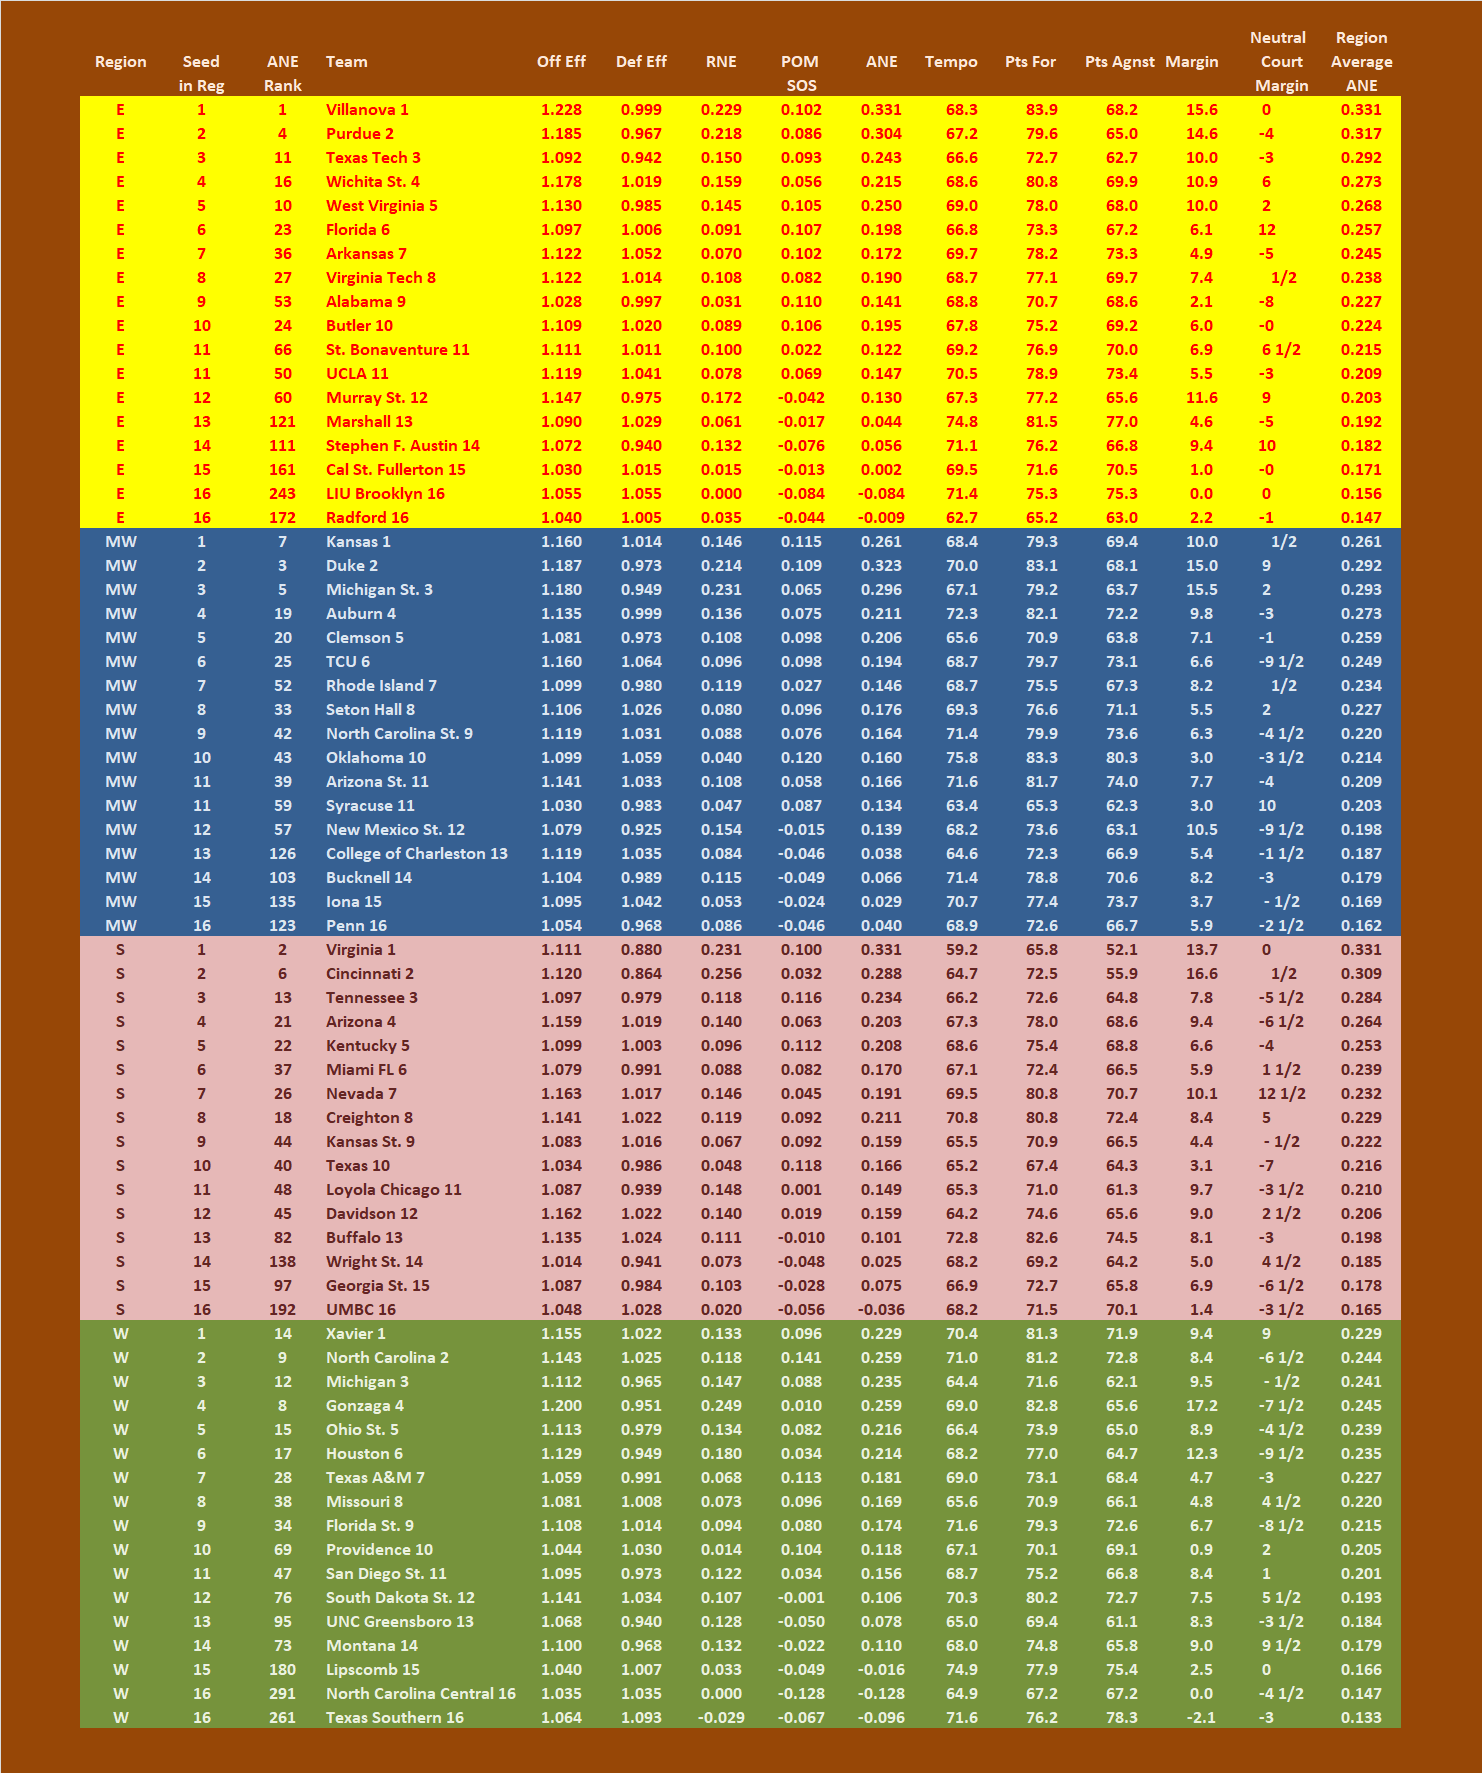
2014 NCAA TEAM DATA
AND NGE RANKING
2017 NCAA TEAM DATA
AND NGE RANKING
First Round
2013 NCAA TEAM DATA
AND NGE RANKING
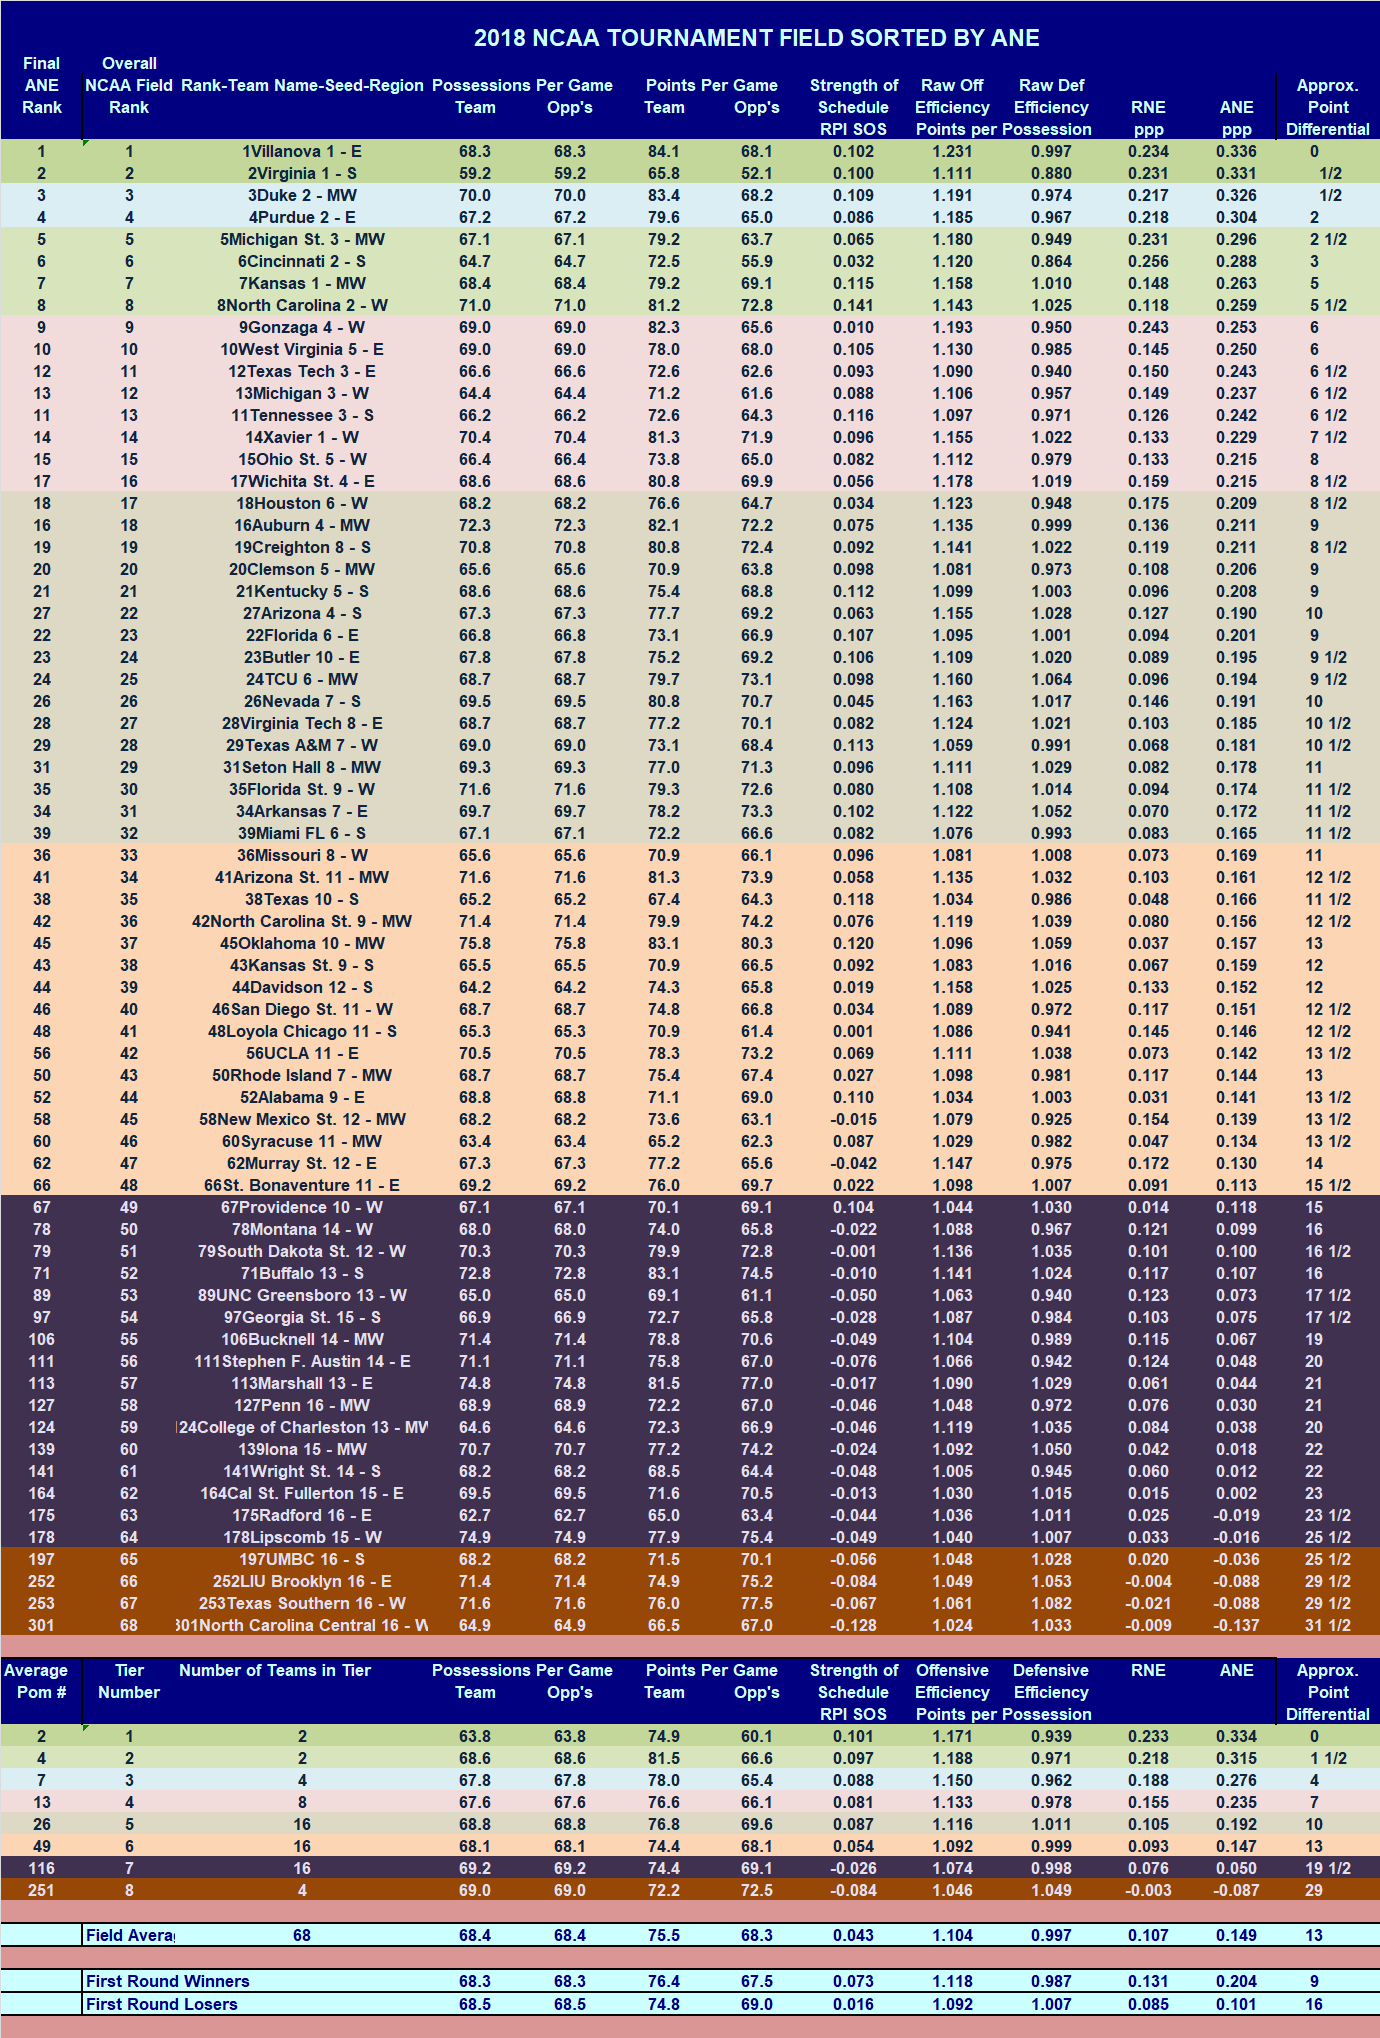
ROUND OF 32-PROJECTED BASED ON ANE
2013 NCAA TEAM DATA
AND NGE RANKING
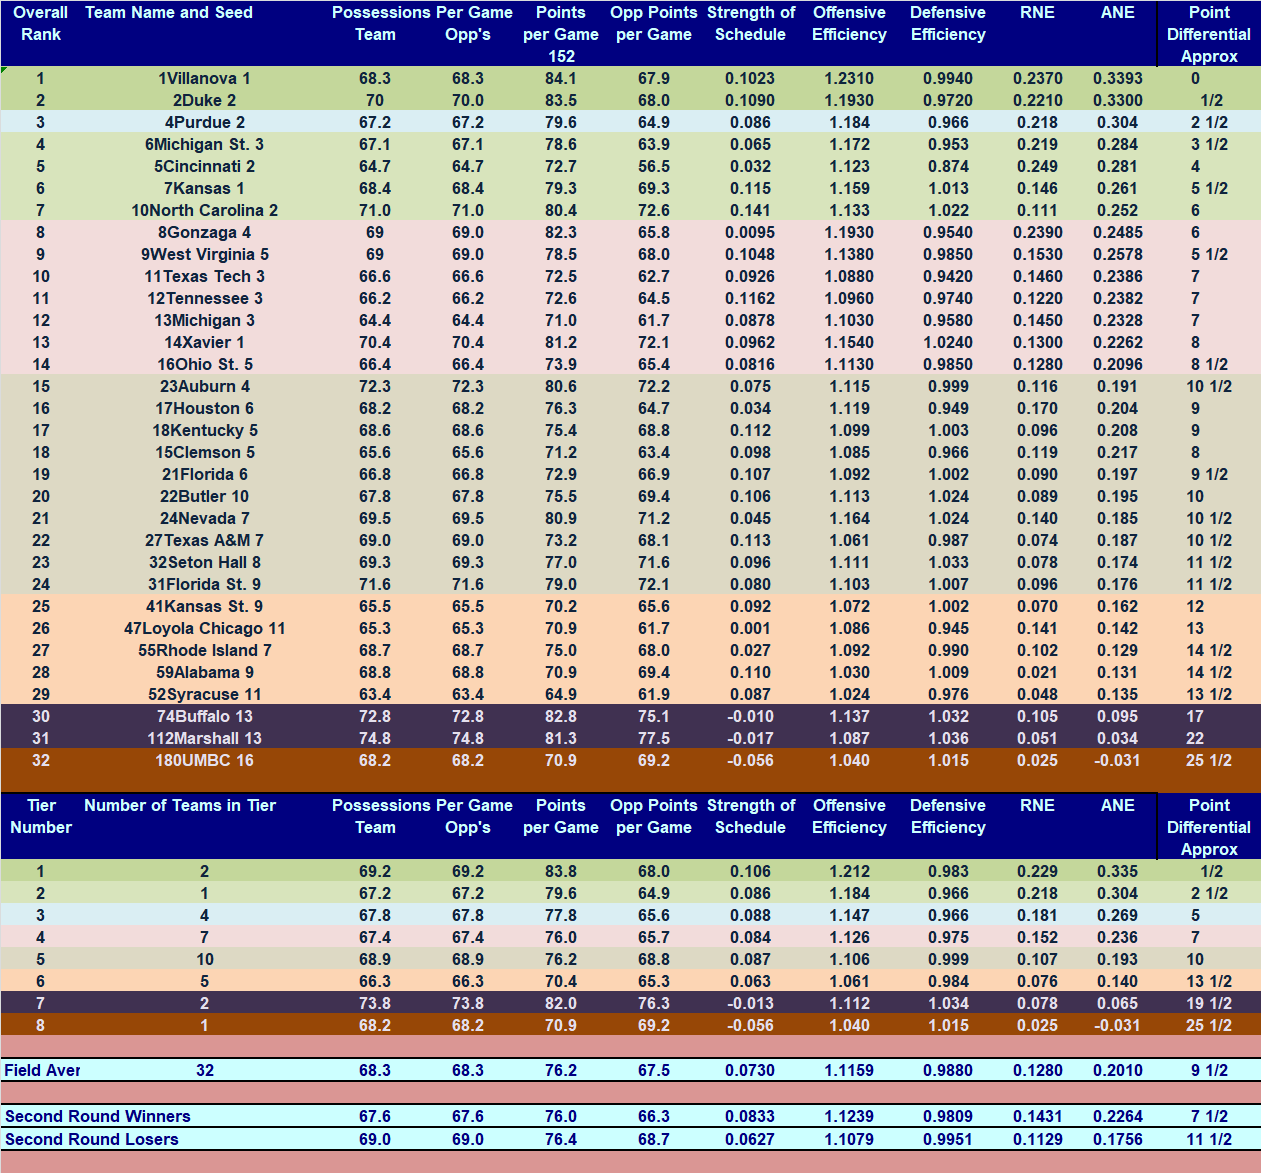
SWEET 16-PROJECTED BASED ON ANE
2013 NCAA TEAM DATA
AND NGE RANKING
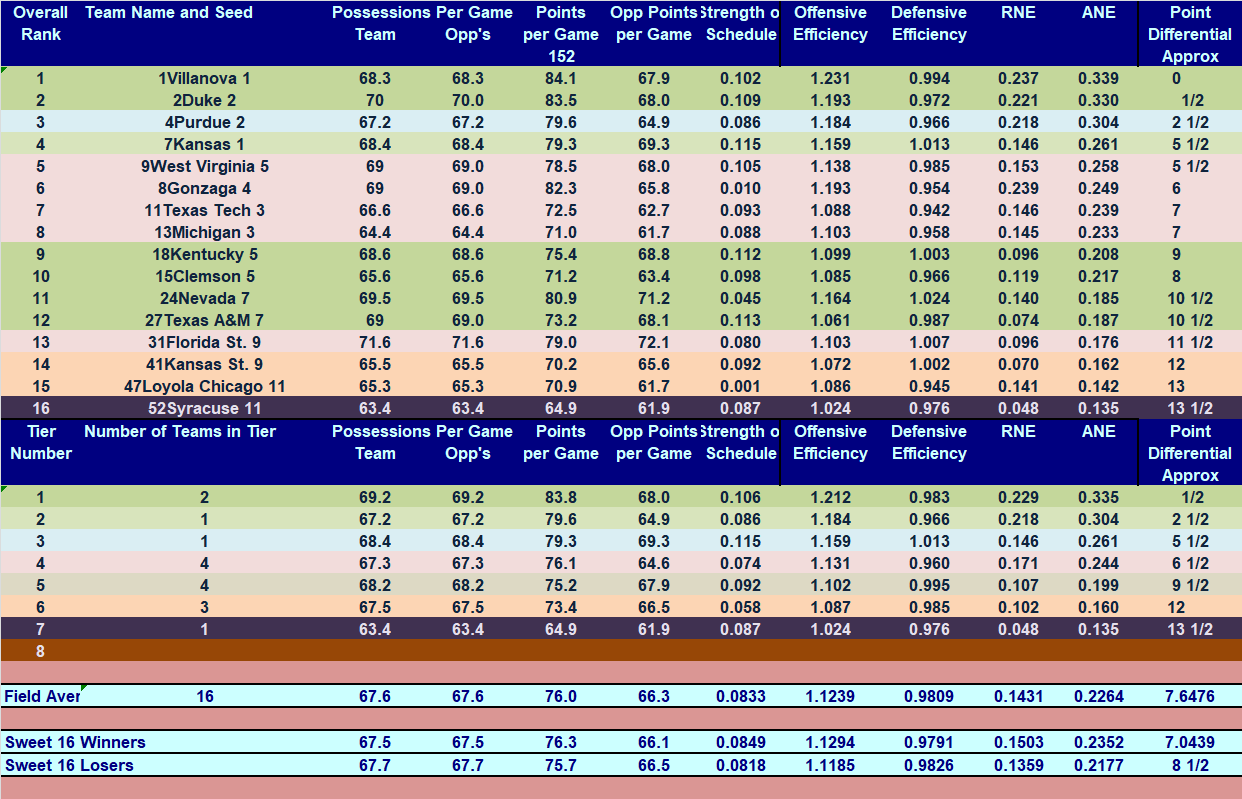
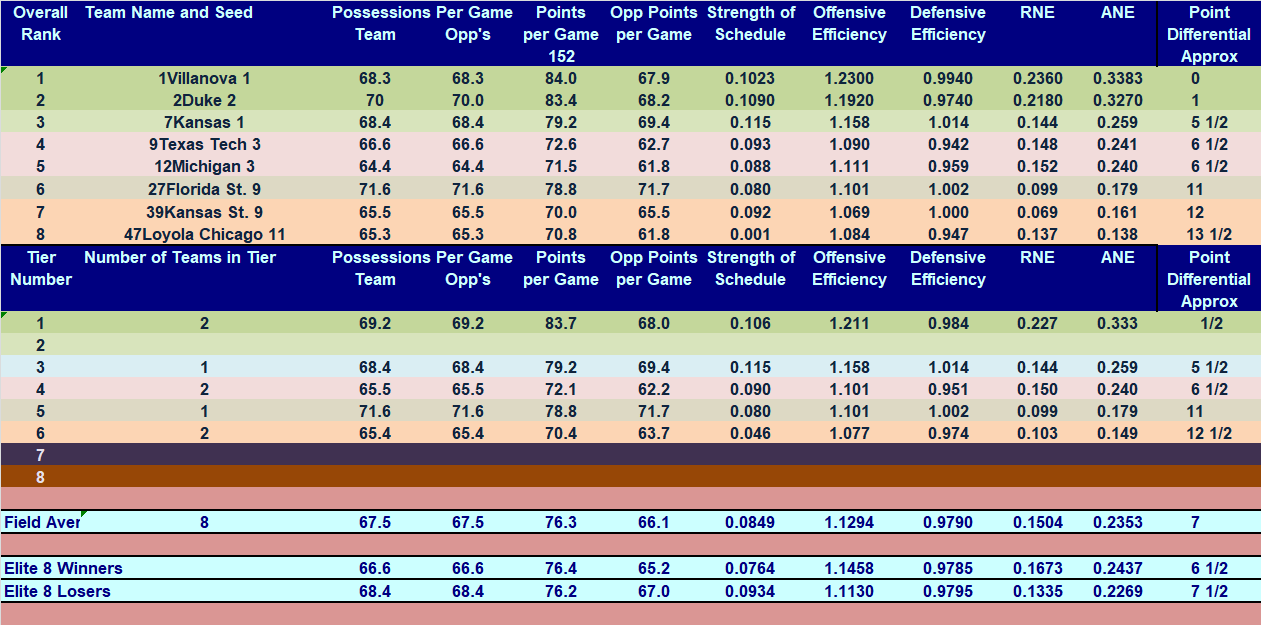
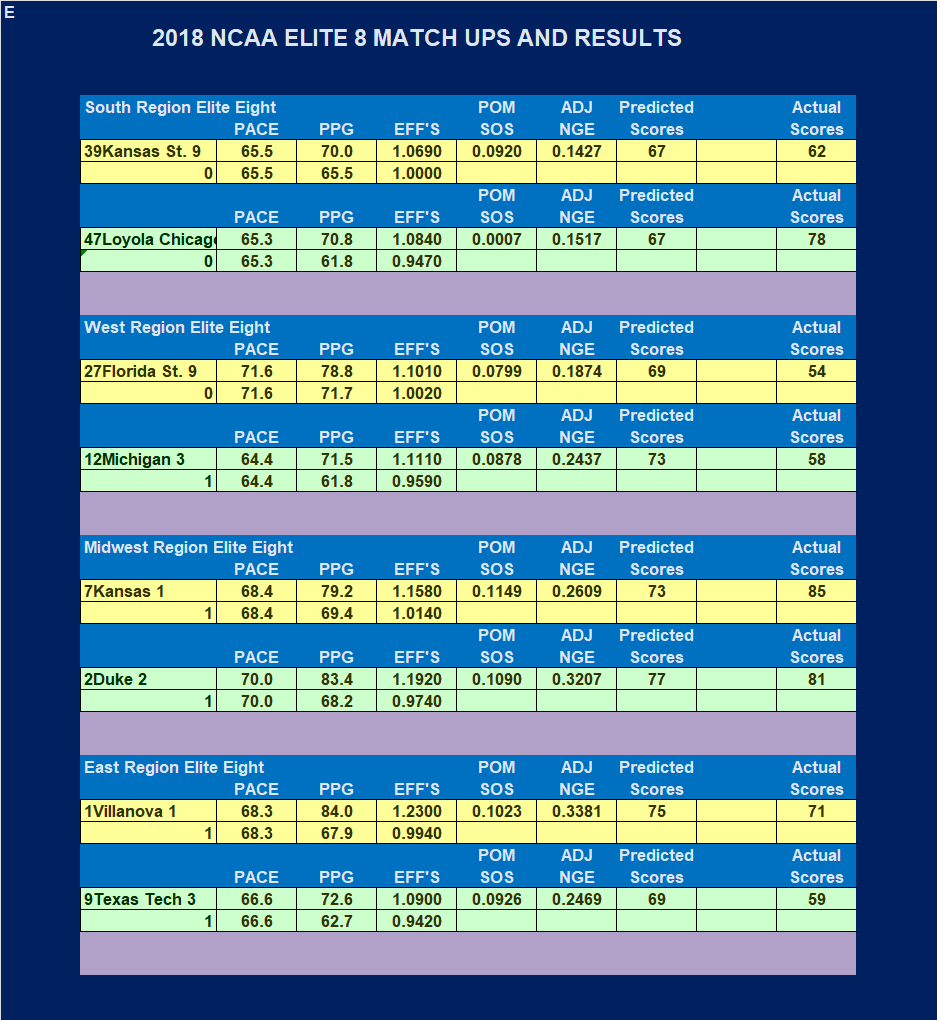
ELITE 8-PROJECTED BASED ON ANE
2013 NCAA TEAM DATA
AND NGE RANKING
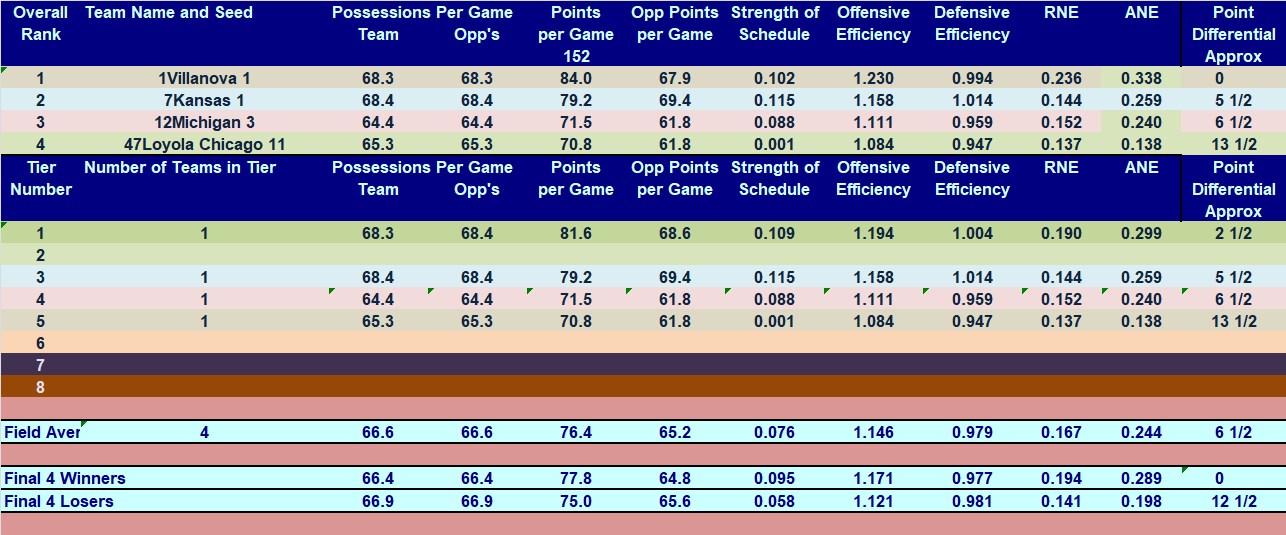
FINAL 4-PROJECTED BASED ON ANE
2013 NCAA TEAM DATA
AND NGE RANKING
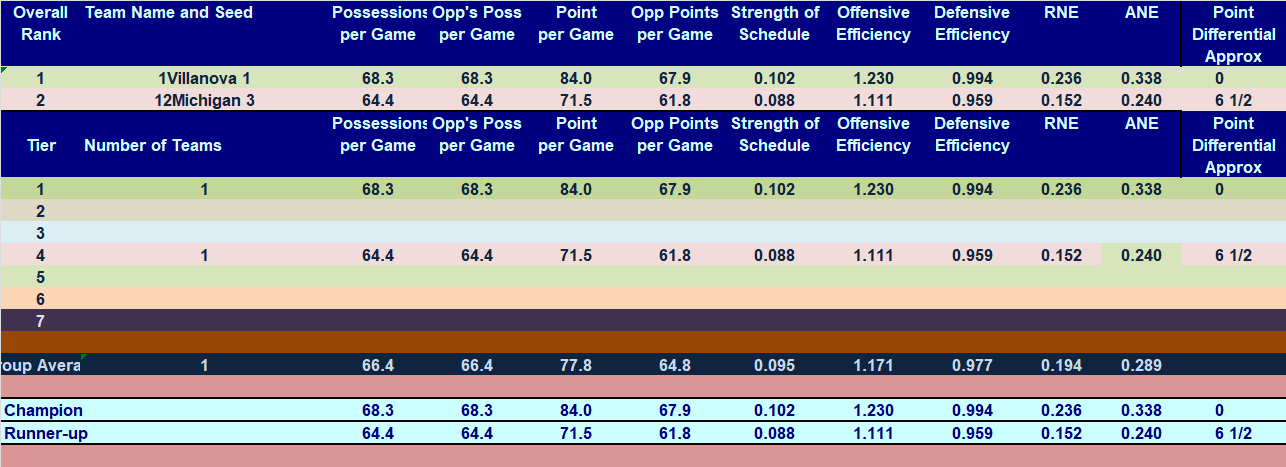
CHAMPIONSHIP GAME--PROJECTED BASED ON ANE
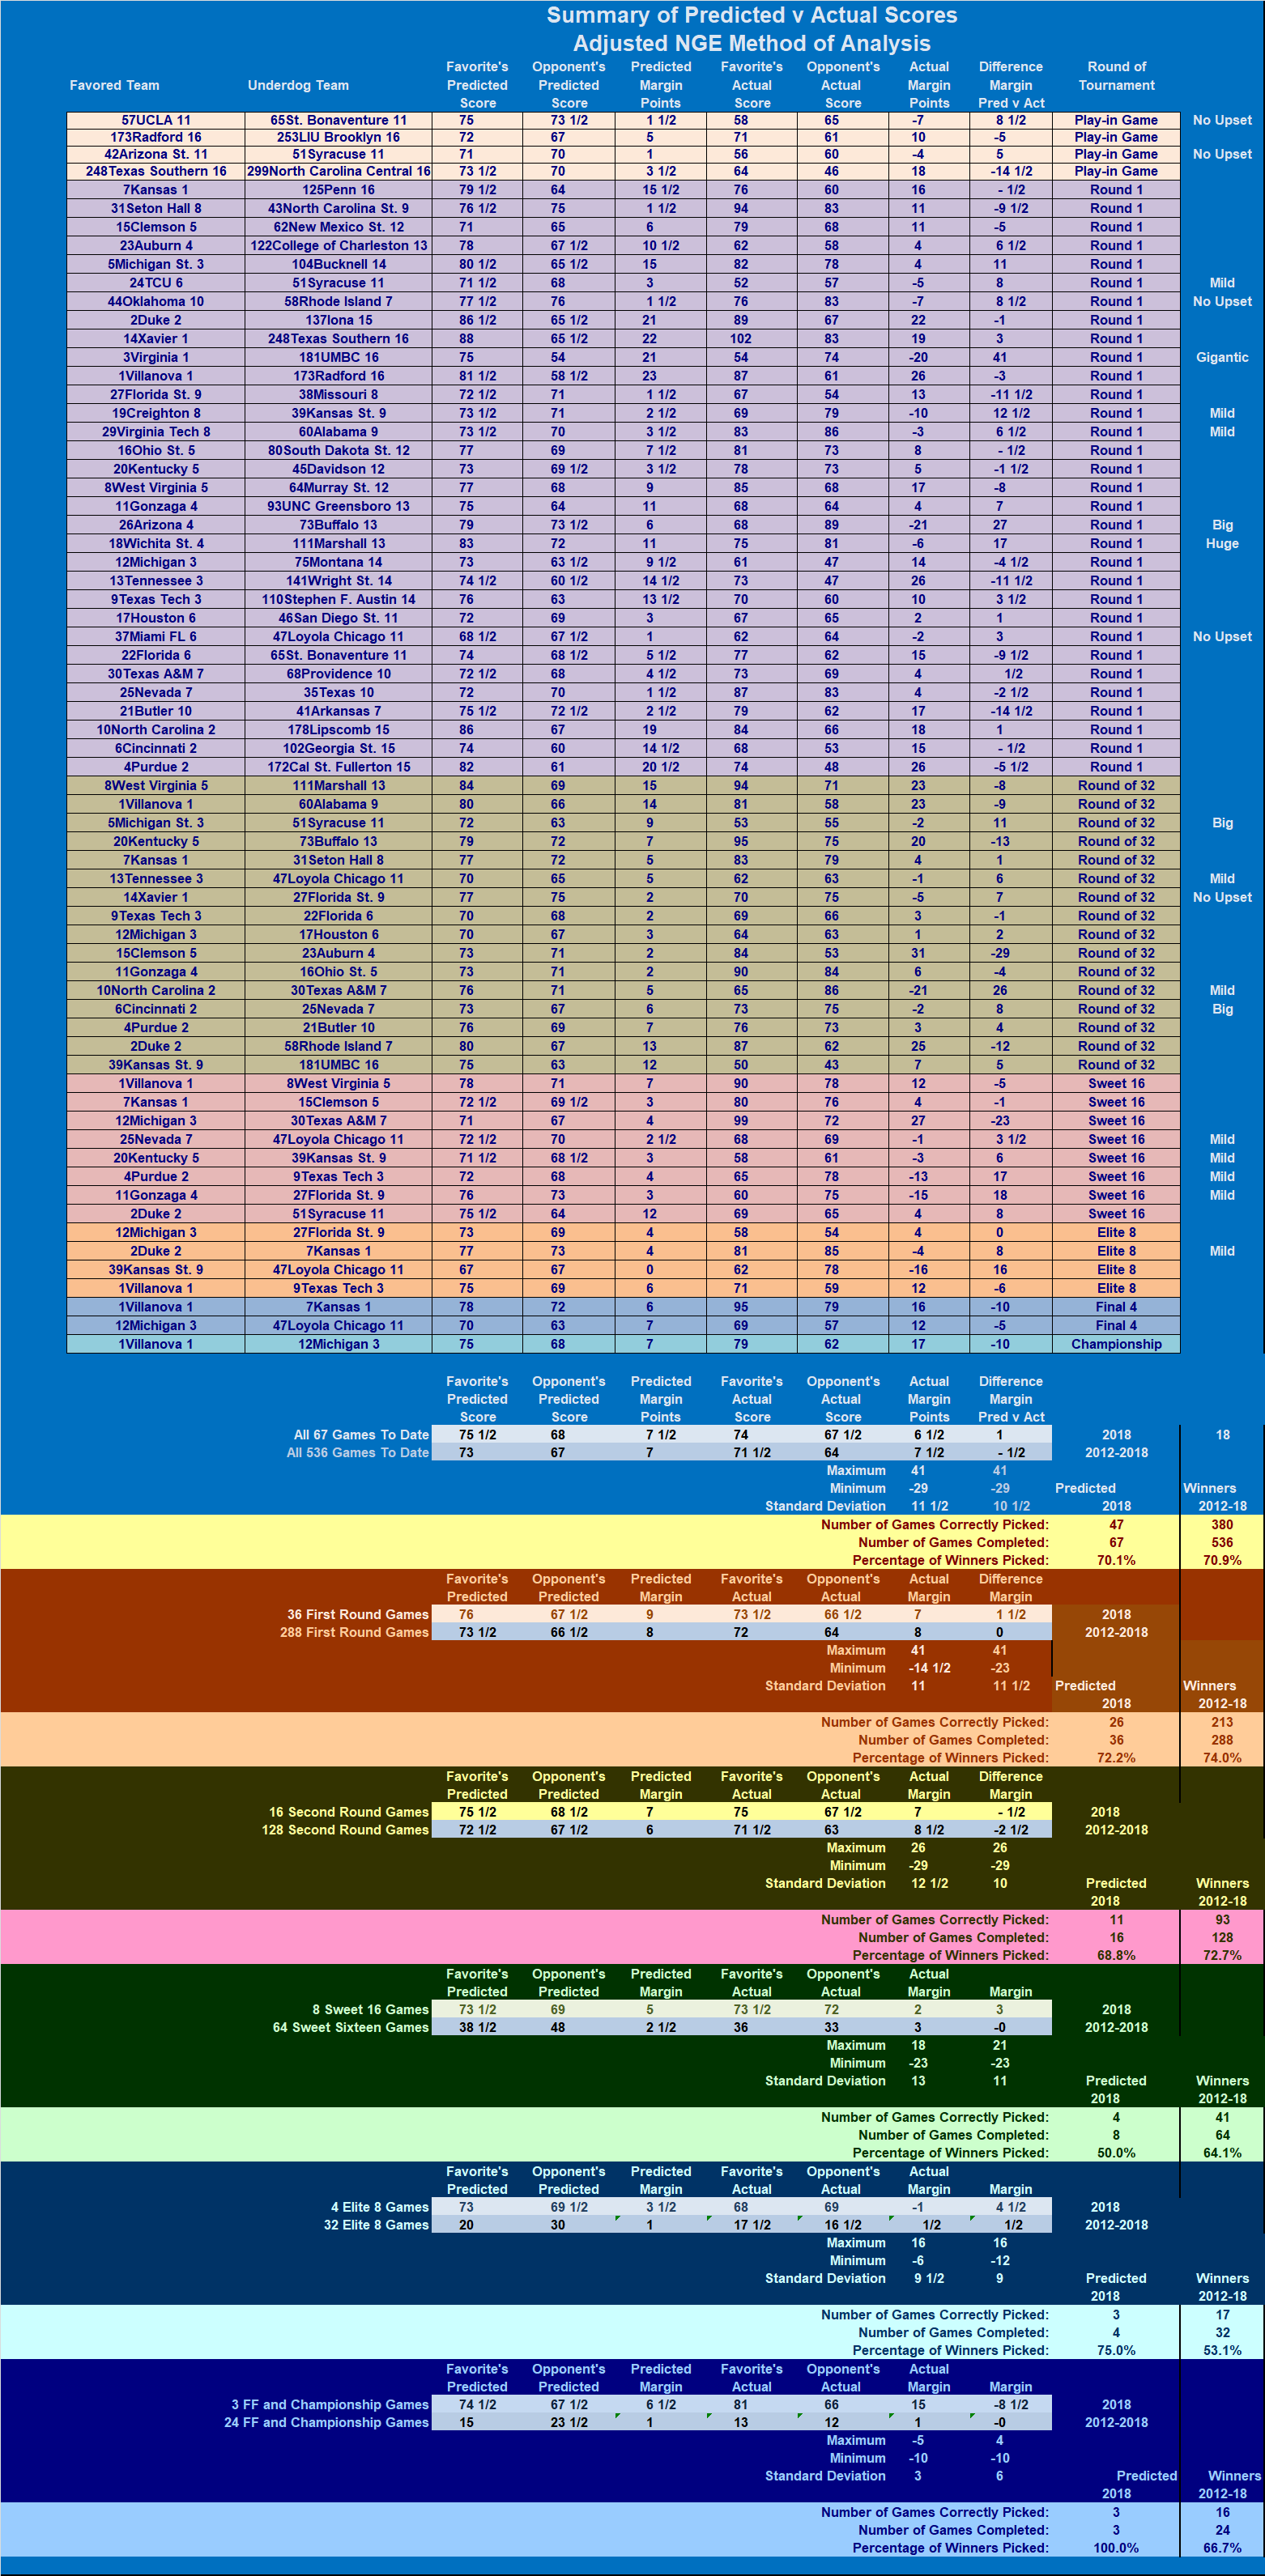
2011 SUMMARY OF PREDICTED V ACTUAL GAME BY GAME RESULTS
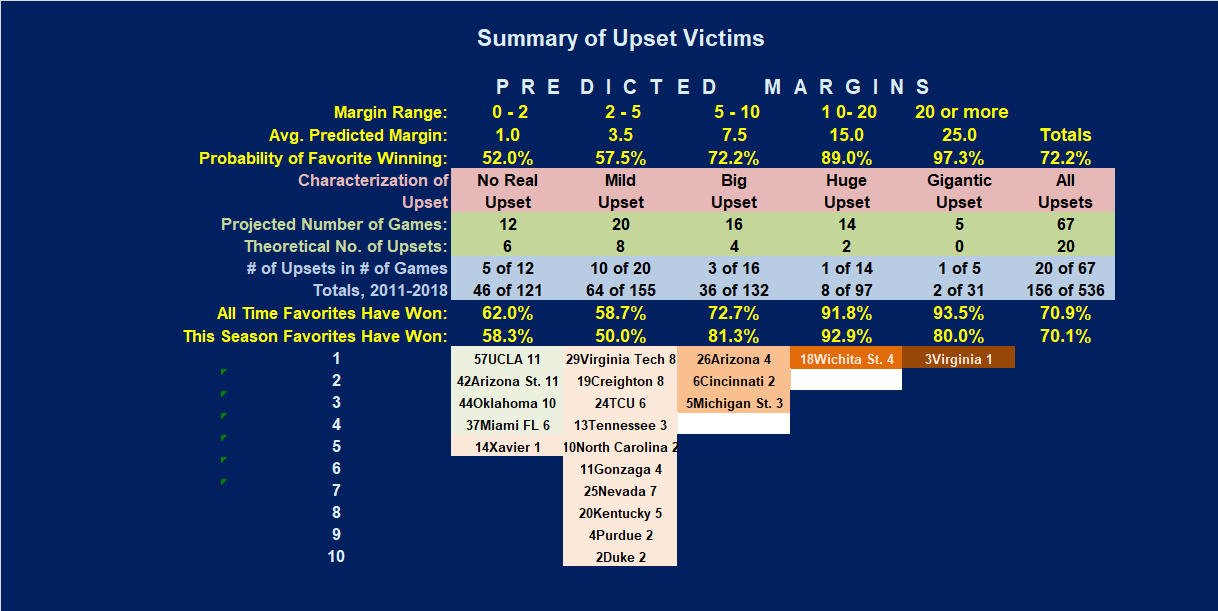
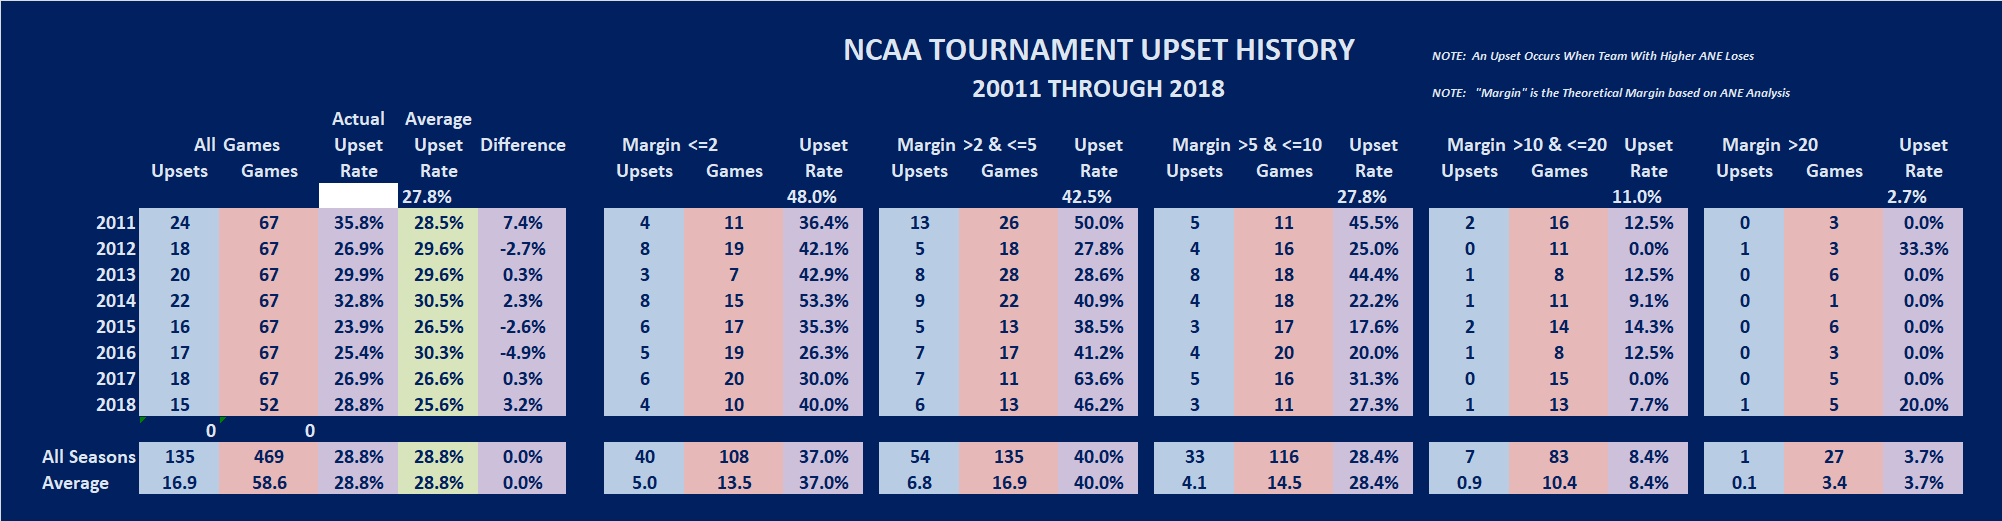
SUMMARY OF UPSET FREQUENCIES AND TOURNAMENT UPSETS
SORTED BY PREDICTED MARGINS-2011

Upsets Occur when a team with the higher ANE loses, and Upsets are always a part of college basketball. Over the last many seasons, the average upset rate for full seasons have been in the 25 to 27% range. Upset rates in the NCAA tournament have been slightly higher, in the range of 26 to 32 percent. Here is the history of NCAA Tournament Upsets since the 2011 Tournament.
The above data is presented in the next series of tables providing more detail in two respects. First, the tables examine more categories of statistics, and second, the data is sorted based on the following factors, in the order shown below:
You may link to any of these sorted data pages using the links above, or you can browse them in sequence using the "Continue" buttons at the bottom of each page.
1. Pace values will be lower, by the number of offensive rebounds.
2. Efficiencies will be higher due to the lower number of total possessions
3. Turnover rates will be higher due to the lower number of possessions.
CHECK OUT THESE OTHER ANALYTICAL WRITINGS
Change in Position on Definition of Possessions
Do Objective Performance Measures Like NGE
Account For Intangible?
Here is an example Possible ANE Based Seeding for 2017

Copyright 2008-15
SugarHill Communications of Kentucky
All Rights Reserve