BIG BLUE FANS FOR
![]()
BASKETBALL
ANALYSIS OF THE KENTUCKY'S
GAME PERFORMANCES
![]()
To the SEASON COMPARISONS WITH NCAA D1 AVERAGES
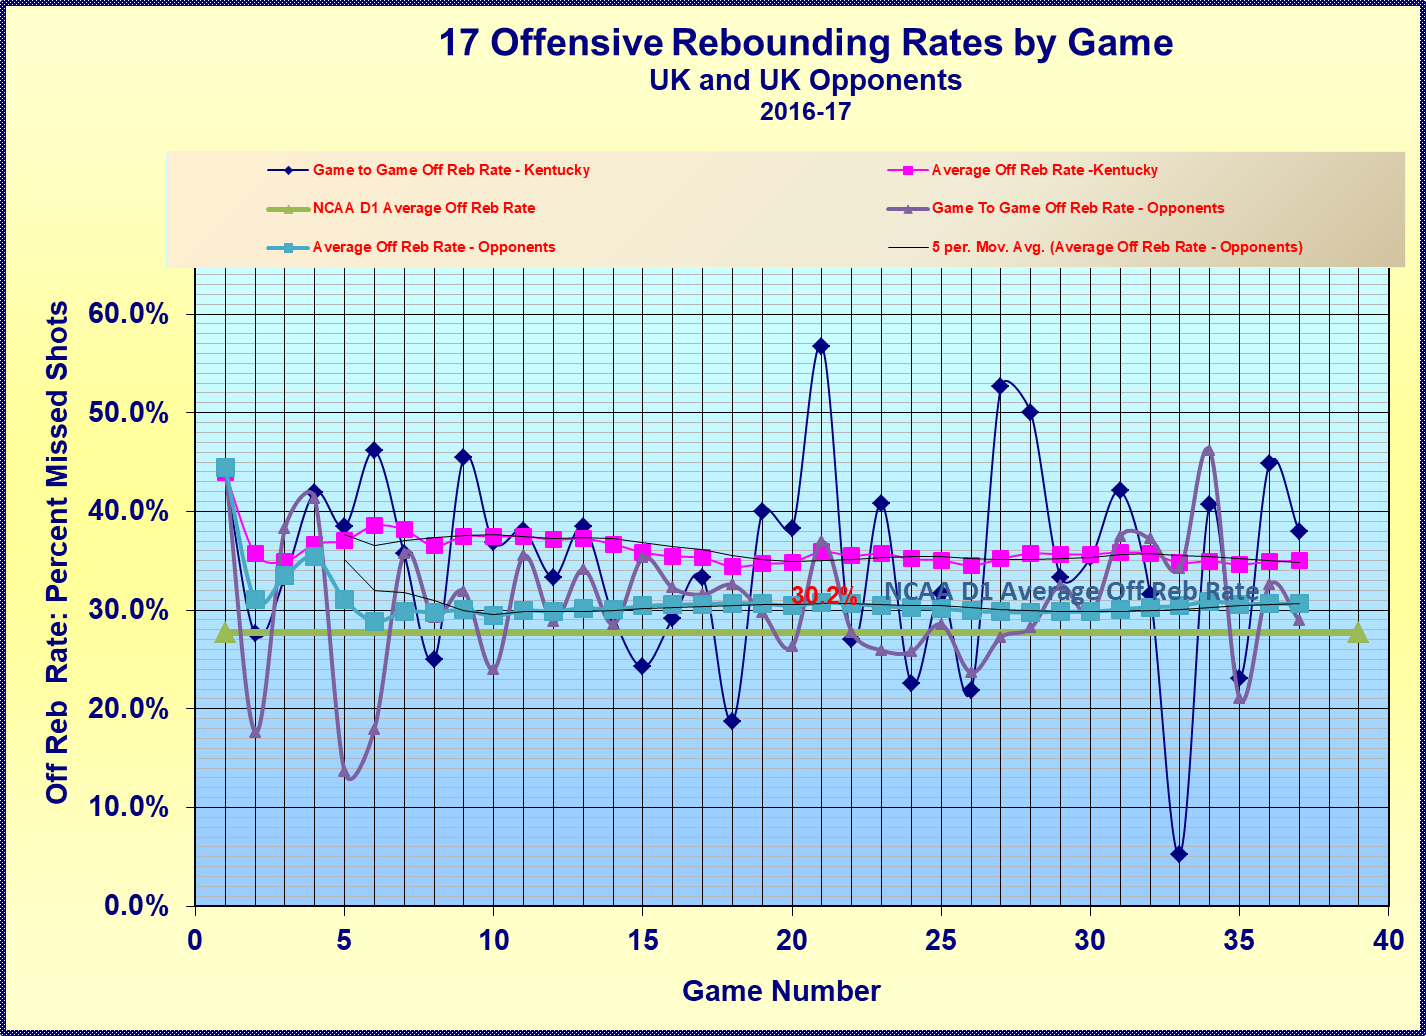
OFFENSIVE REBOUNDING EFFICIENCY
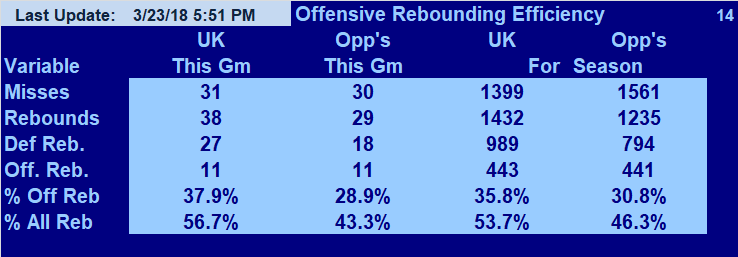
The Percentage of Offensive Rebounds is
the number of Offensive Rebounds
divided by the total number of reboundable misses.
Individual Efficiency Table
GAME BY GAME GRADES
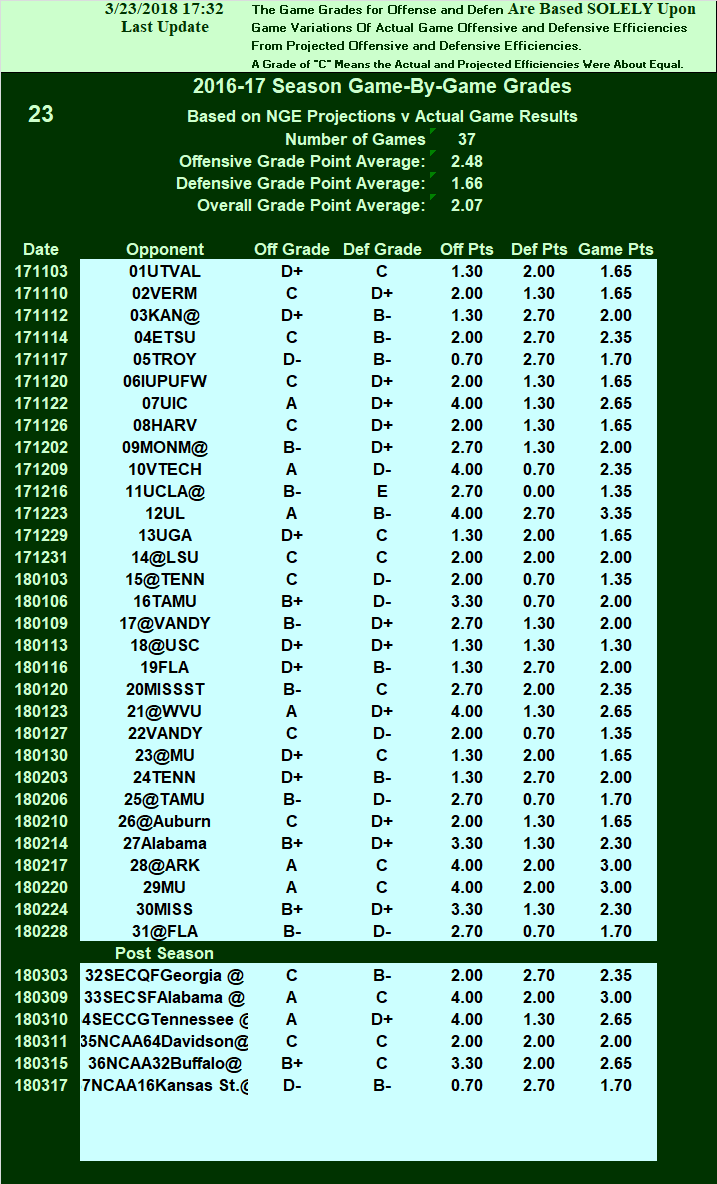

The Game Grades for Offense and Defense
Are Based SOLELY Upon
Game Variations Of Actual Game Offensive and Defensive Efficiencies
From
Projected Offensive and Defensive Efficiencies.
A Grade of "C" Means the Actual and Projected Efficiencies Were About Equal.
If A Team Is Playing Very Well Overall,
Then "C" means That Team Again Played Very Well.
If A Team Is Playing Very Poorly Overall,
Then "C" means That Team Again Played Very Poorly.
5-GAME RUNNING AVERAGE GRADES
"C" = 2.0
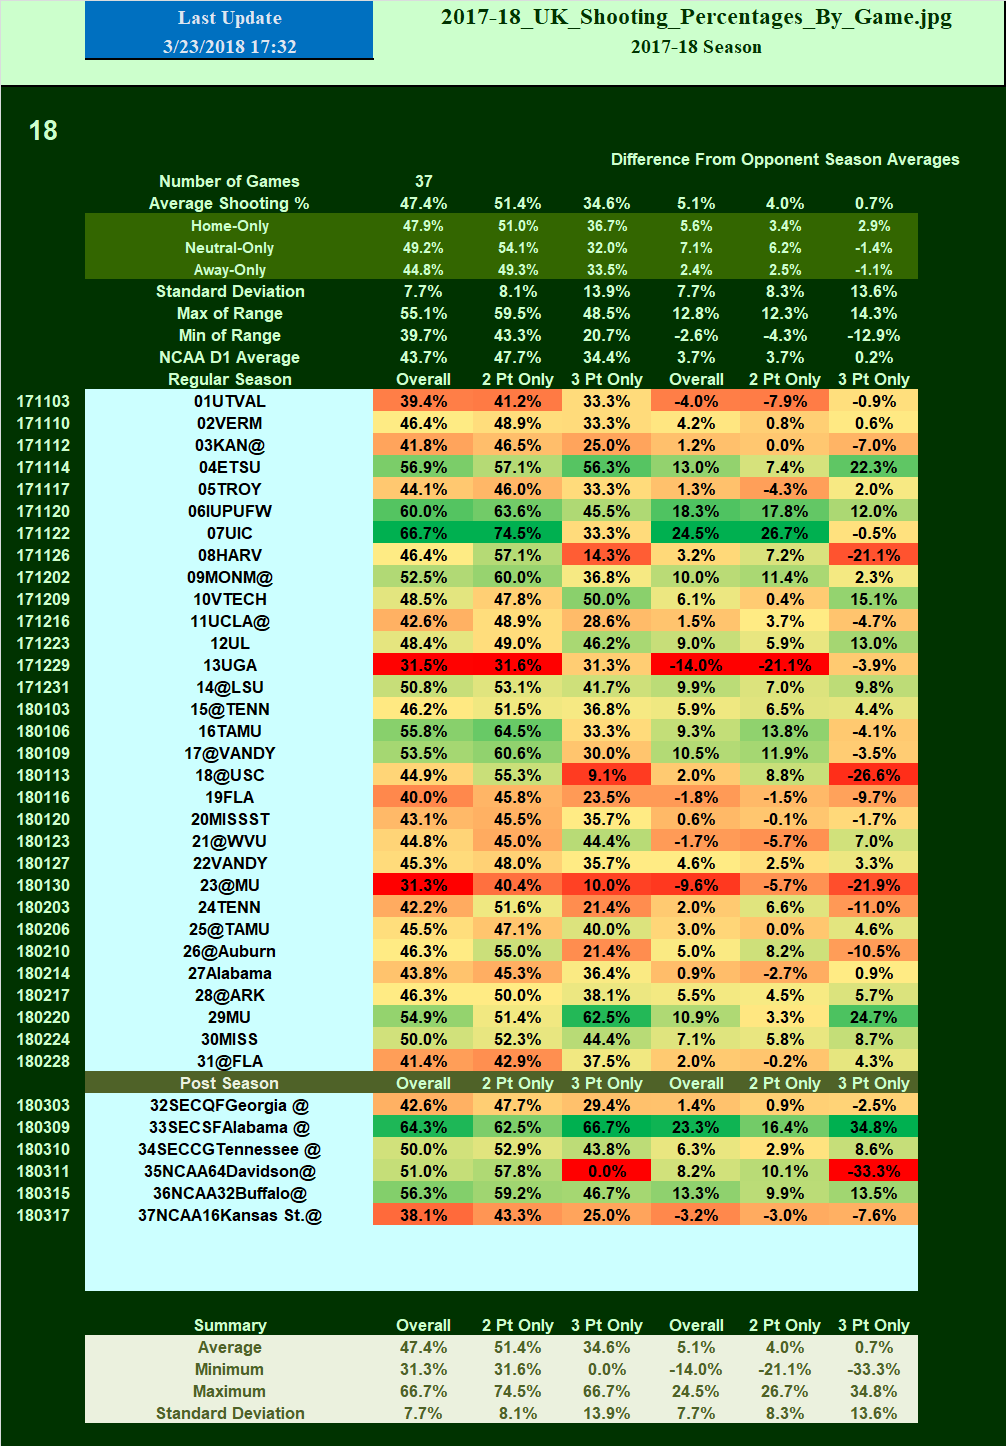
KENTUCKY SHOOTING PERCENTAGE BY GAME
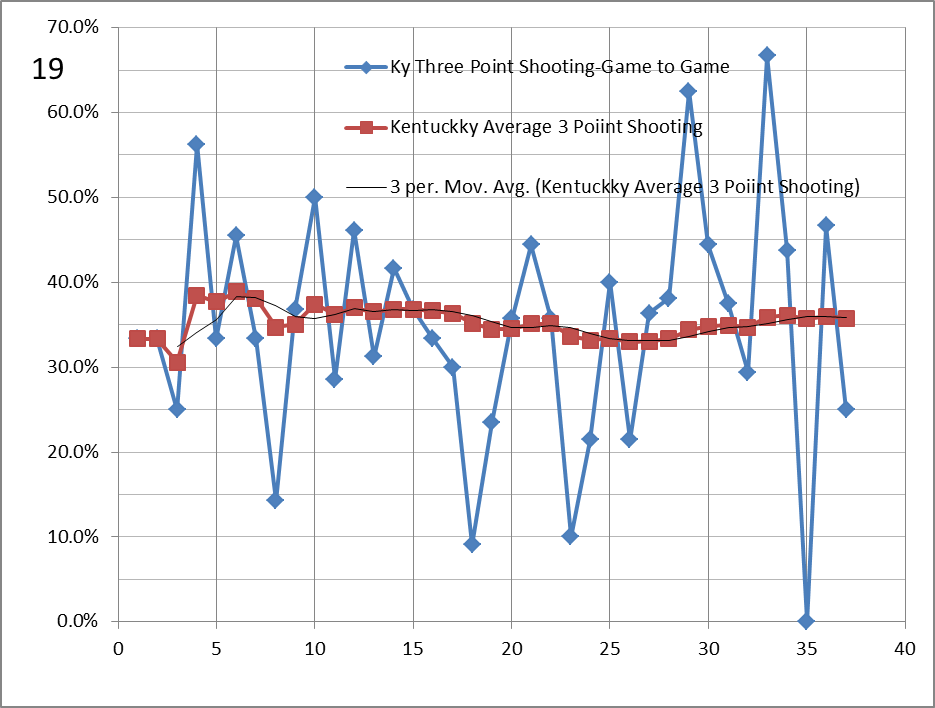
KENTUCKY 3 POINT SHOOTING BY GAME
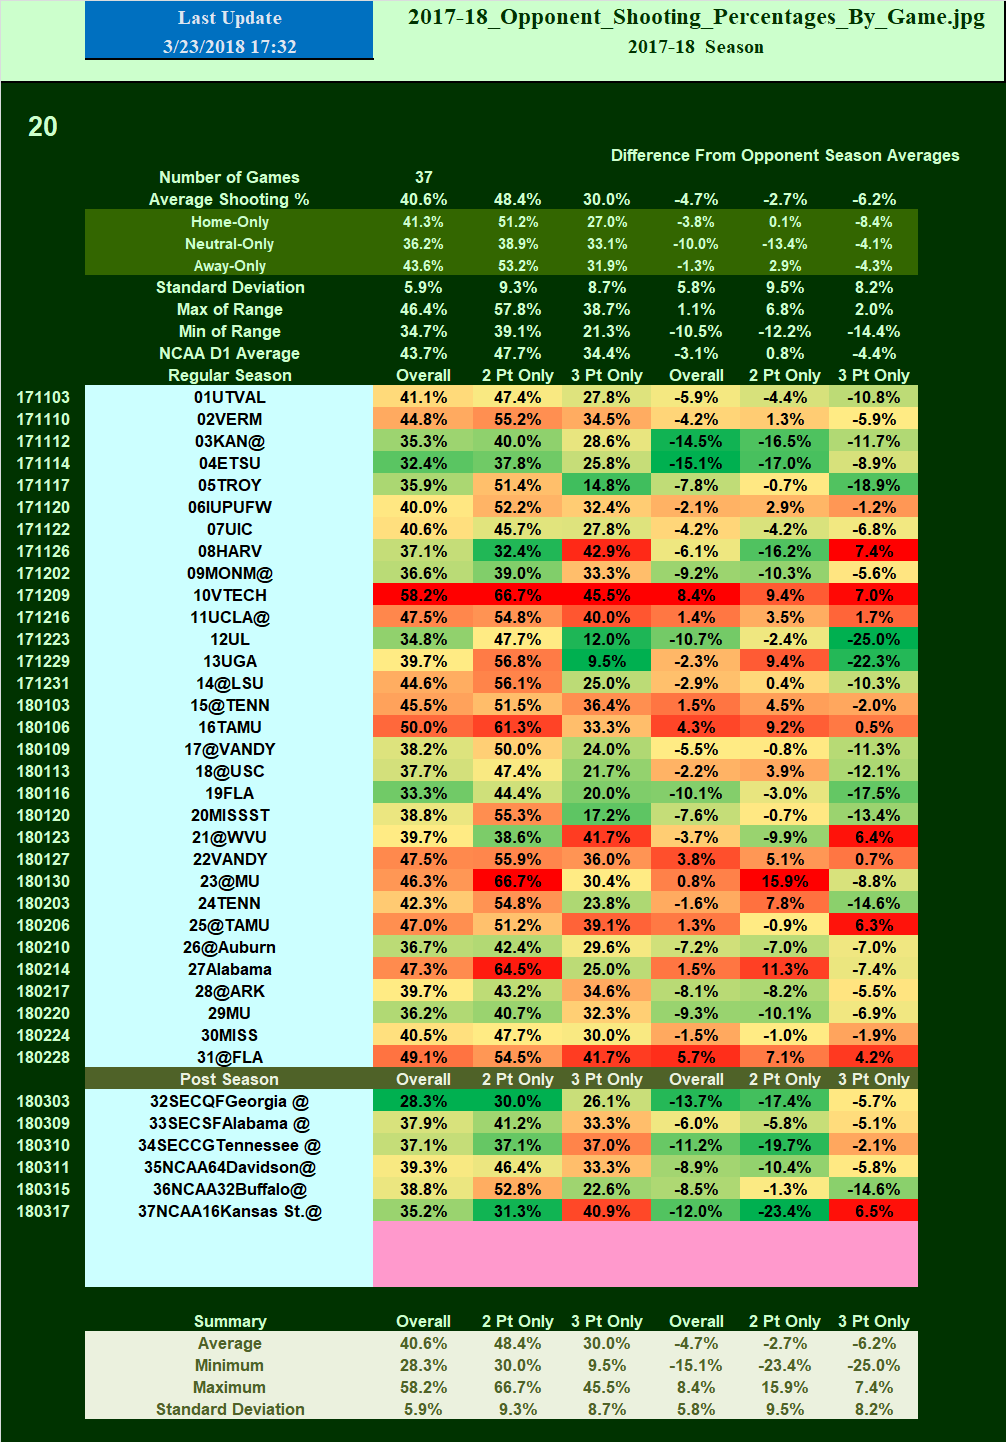
OPPONENT SHOOTING PERCENTAGE BY GAME
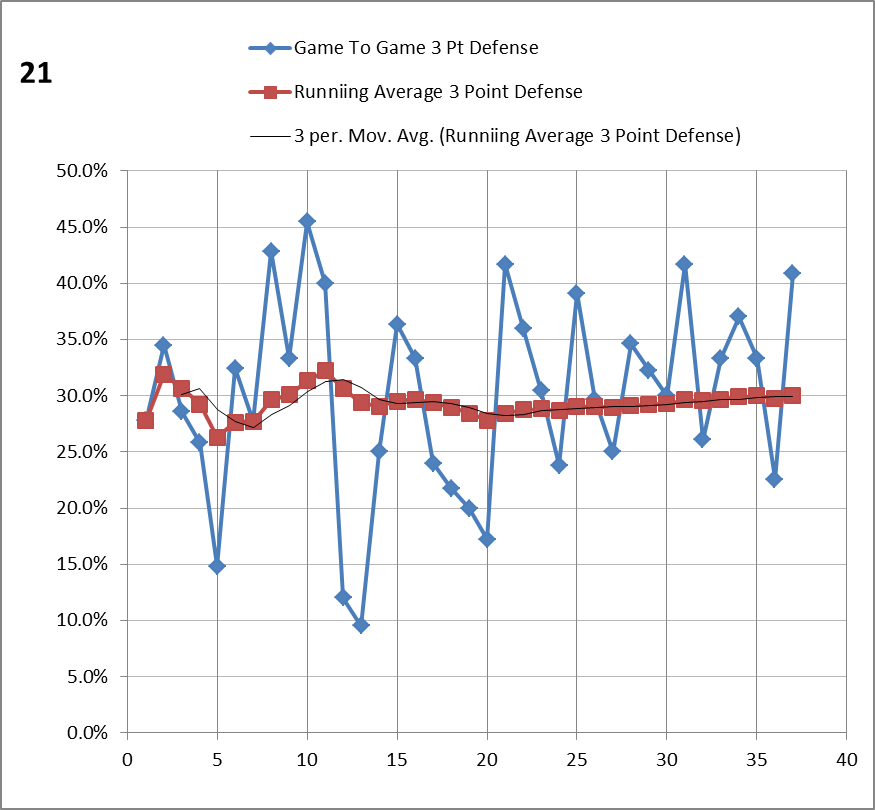
OPPONENT 3 POINT SHOOTING BY GAME
KENTUCKY OPPONENT SHOOTING DIFFERENTIAL BY GAME
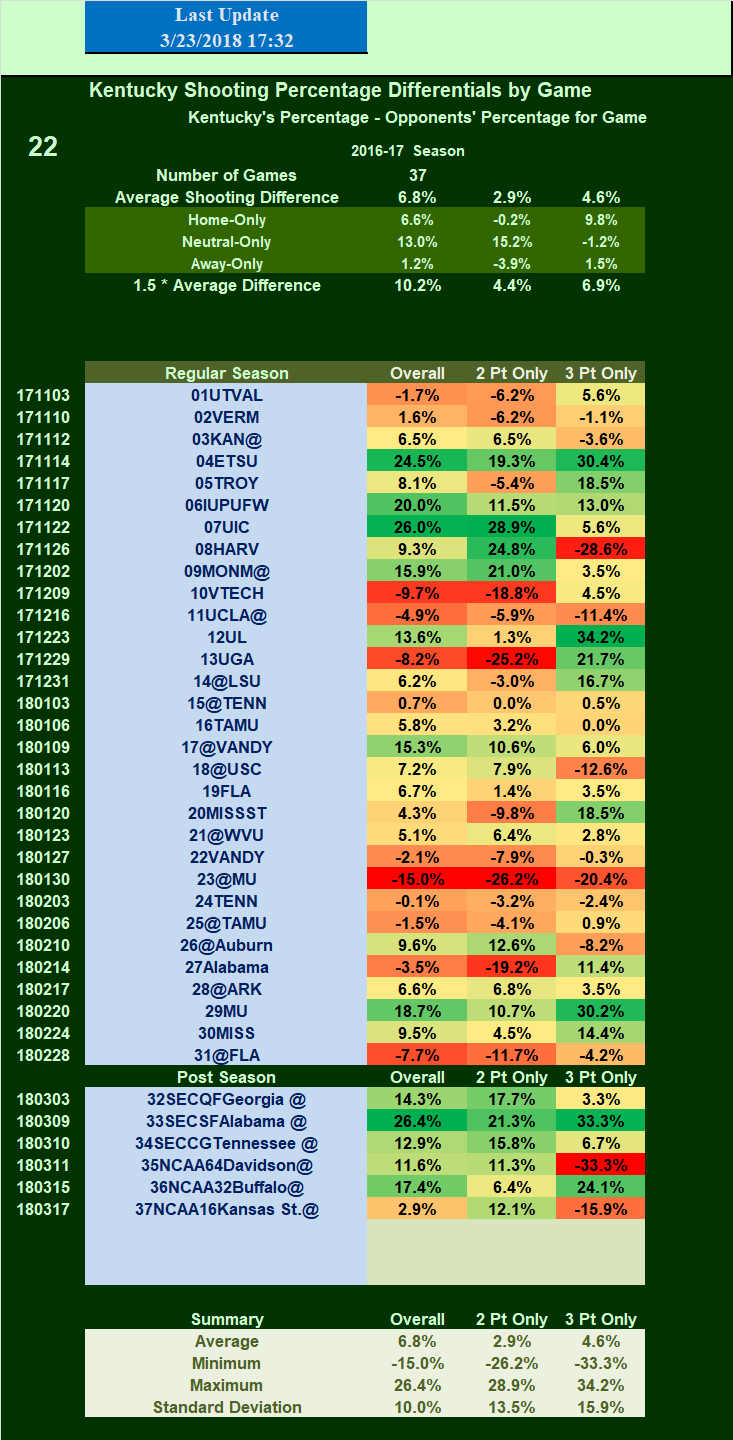
Shooting Percentages Should Be Self-Explanatory
Columns are: Date, Opponent, Total Shooting, and 3-Point Shooting
Comparisons To NCAA D1 Averages, and Consistency Also Addressed
PACE, POSSESSIONS PER GAME, BY GAME
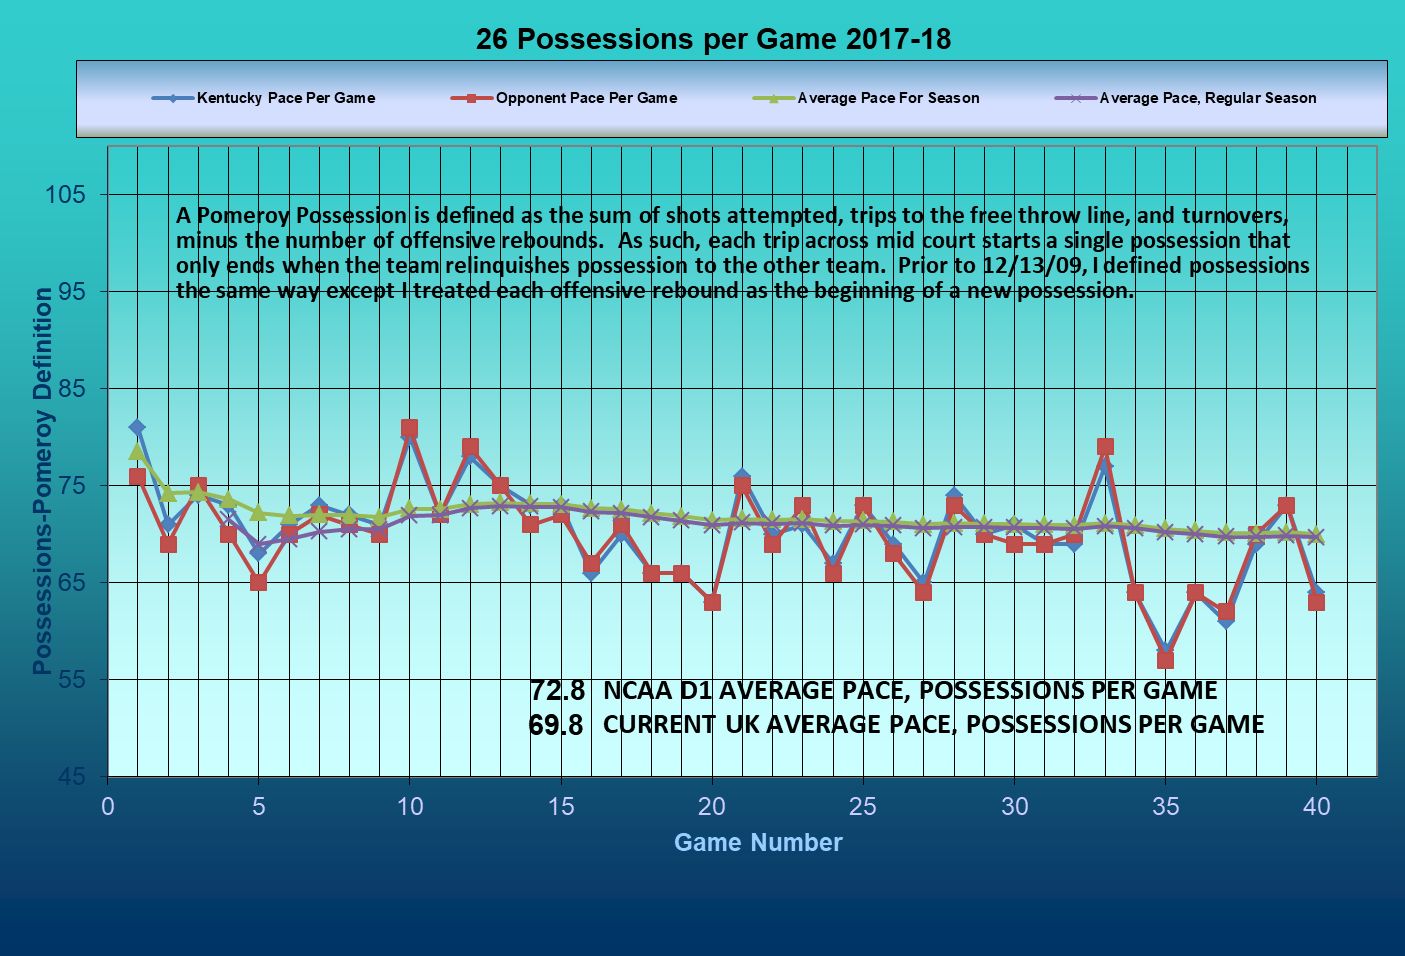
Pace Should Be Self-Explanatory
A Possession Occurs when a team makes a basket,
makes free throws ending their possession, or makes a turnover.
If a team misses a shot, and loses possession, it is a possession for that team,
but if a team misses a shot and retains possession,
it is not a complete possession until one of the previously identified
events occur to end the possession
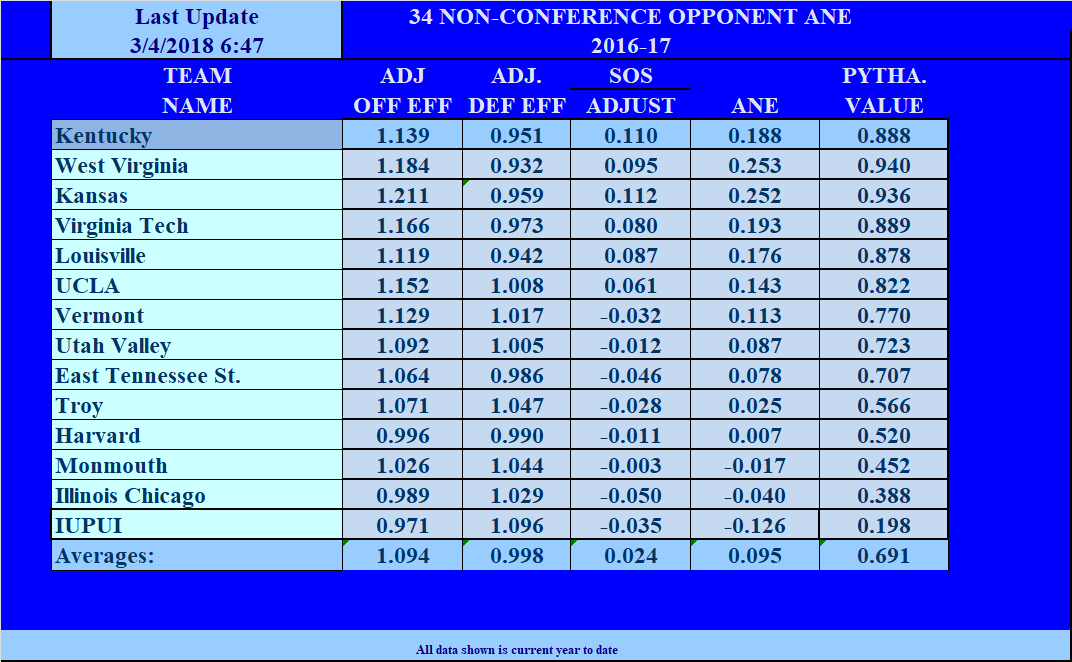
SUMMARY OF NON-CONFERENCE OPPONENT STRENGTH
SORTED BY PROJECTED GAME MARGIN, SMALLEST TO LARGEST
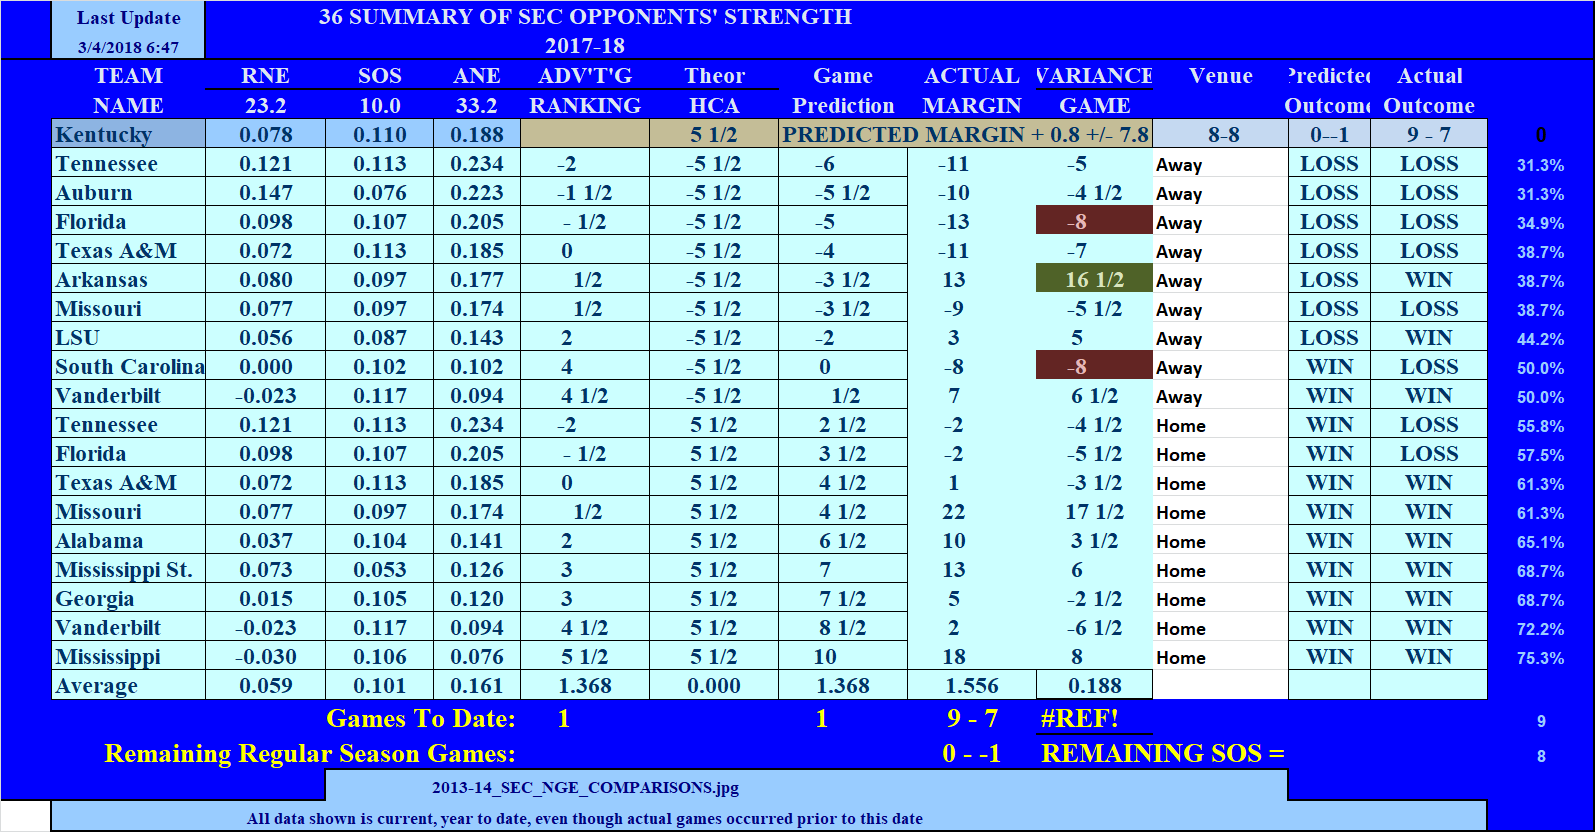
SUMMARY OF CONFERENCE OPPONENT STRENGTH
SORTED BY PROJECTED GAME MARGIN, SMALLEST TO LARGEST
SUMMARY OF ALL OPPONENT STRENGTH
SORTED BY PROJECTED GAME MARGIN, SMALLEST TO LARGEST
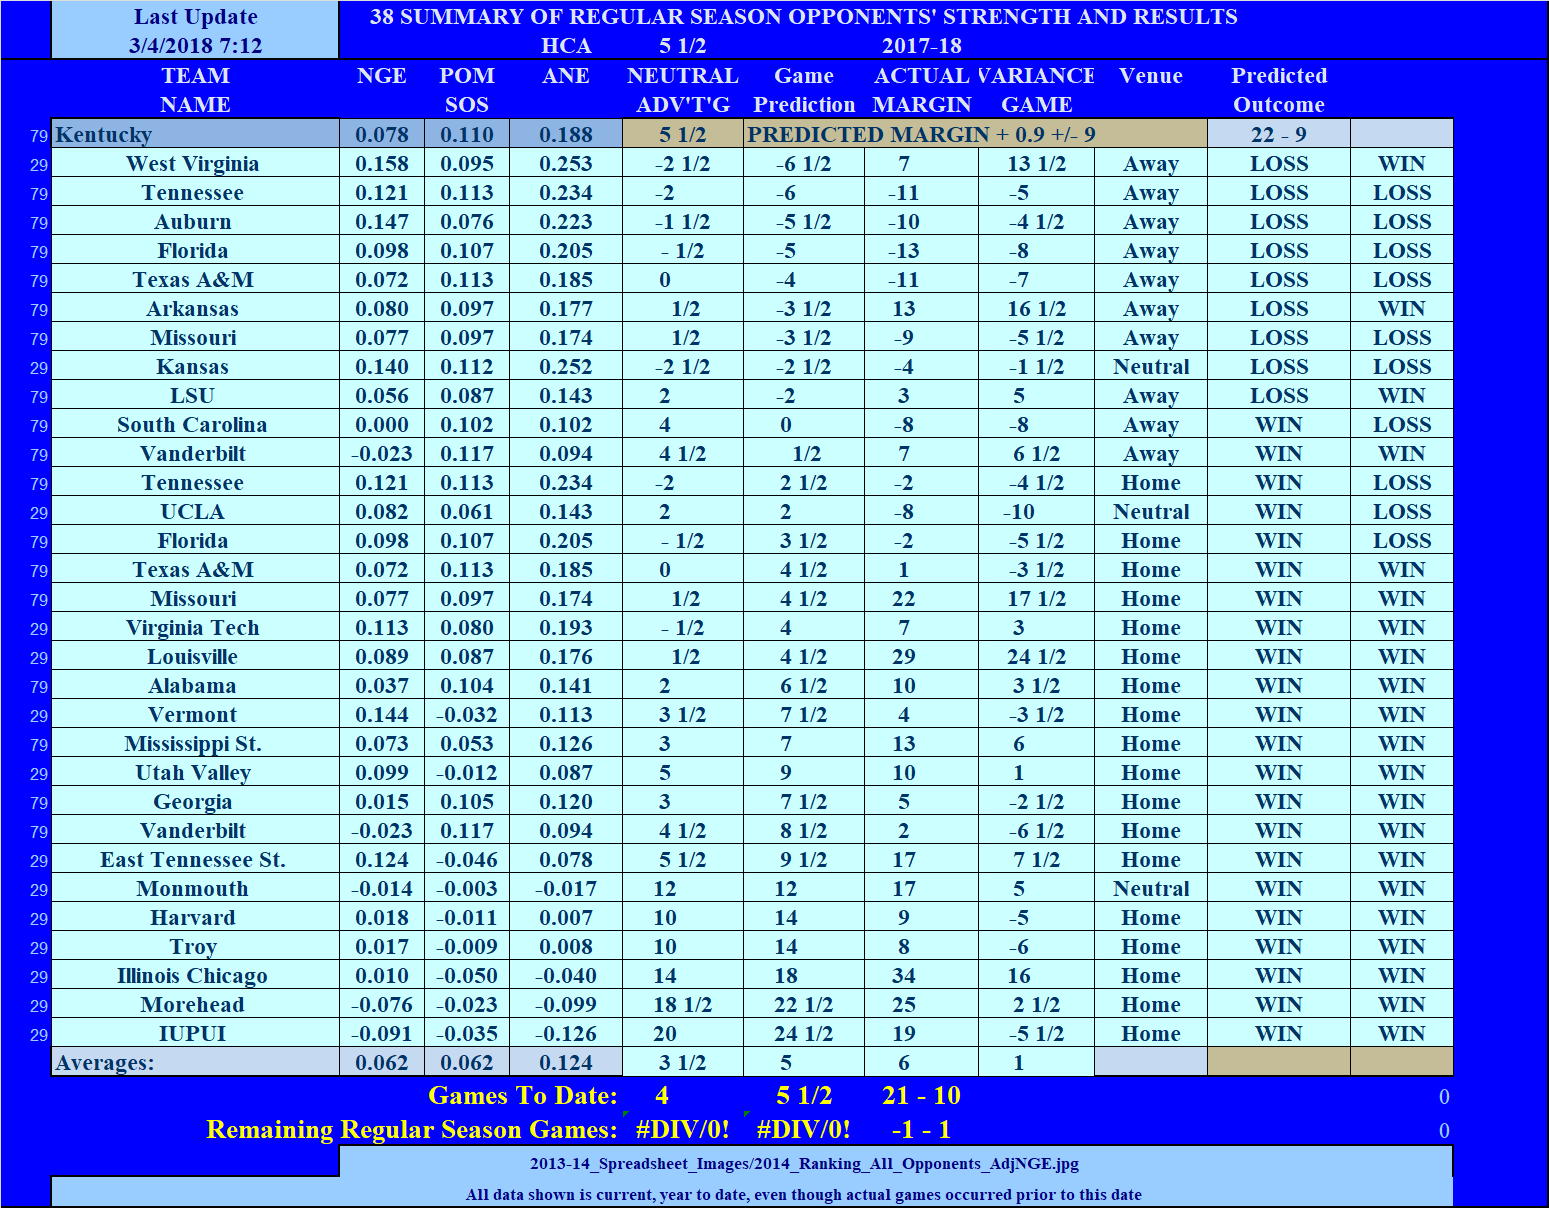
The Above Tables Provide A Current Ranking of All UK Opponents
Based On the Current Adjusted NGE.
The Current Predicted Margin For That Game Is Based on
Venue and Current Adjusted NGE Ranking.
This is a very dynamic analysis and varies throughout the season
as teams play additional games, as their raw NGE fluccuates, and
as their schedule strength varies.
TURNOVER RATE BY GAME
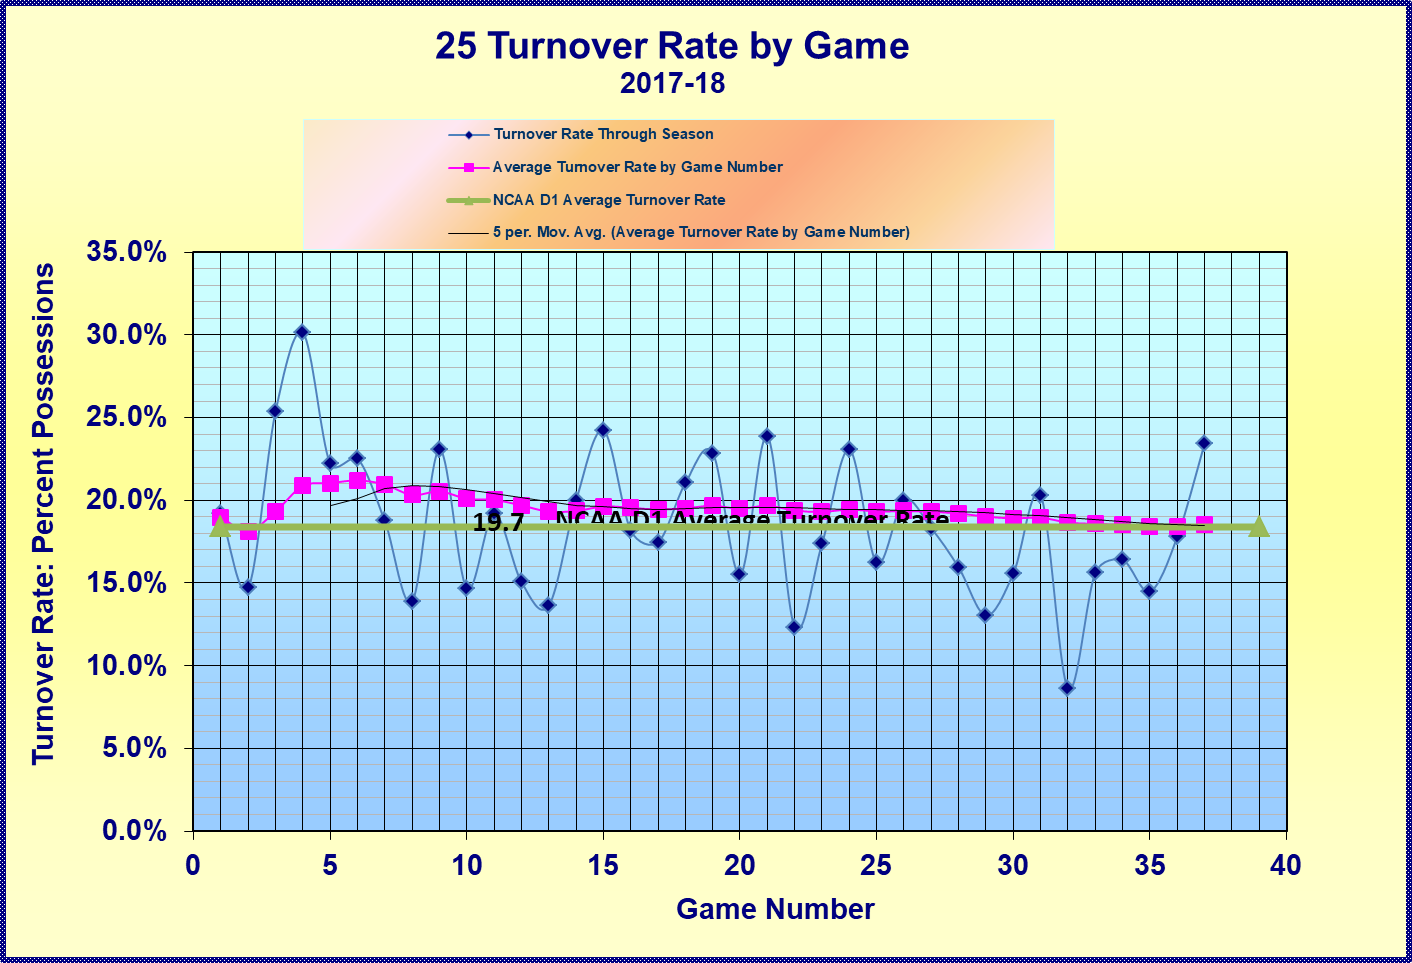
Turnover Rates, Percentage of Total Possessions Ending with Turnovers
Game by Game, and Season Averages Presented
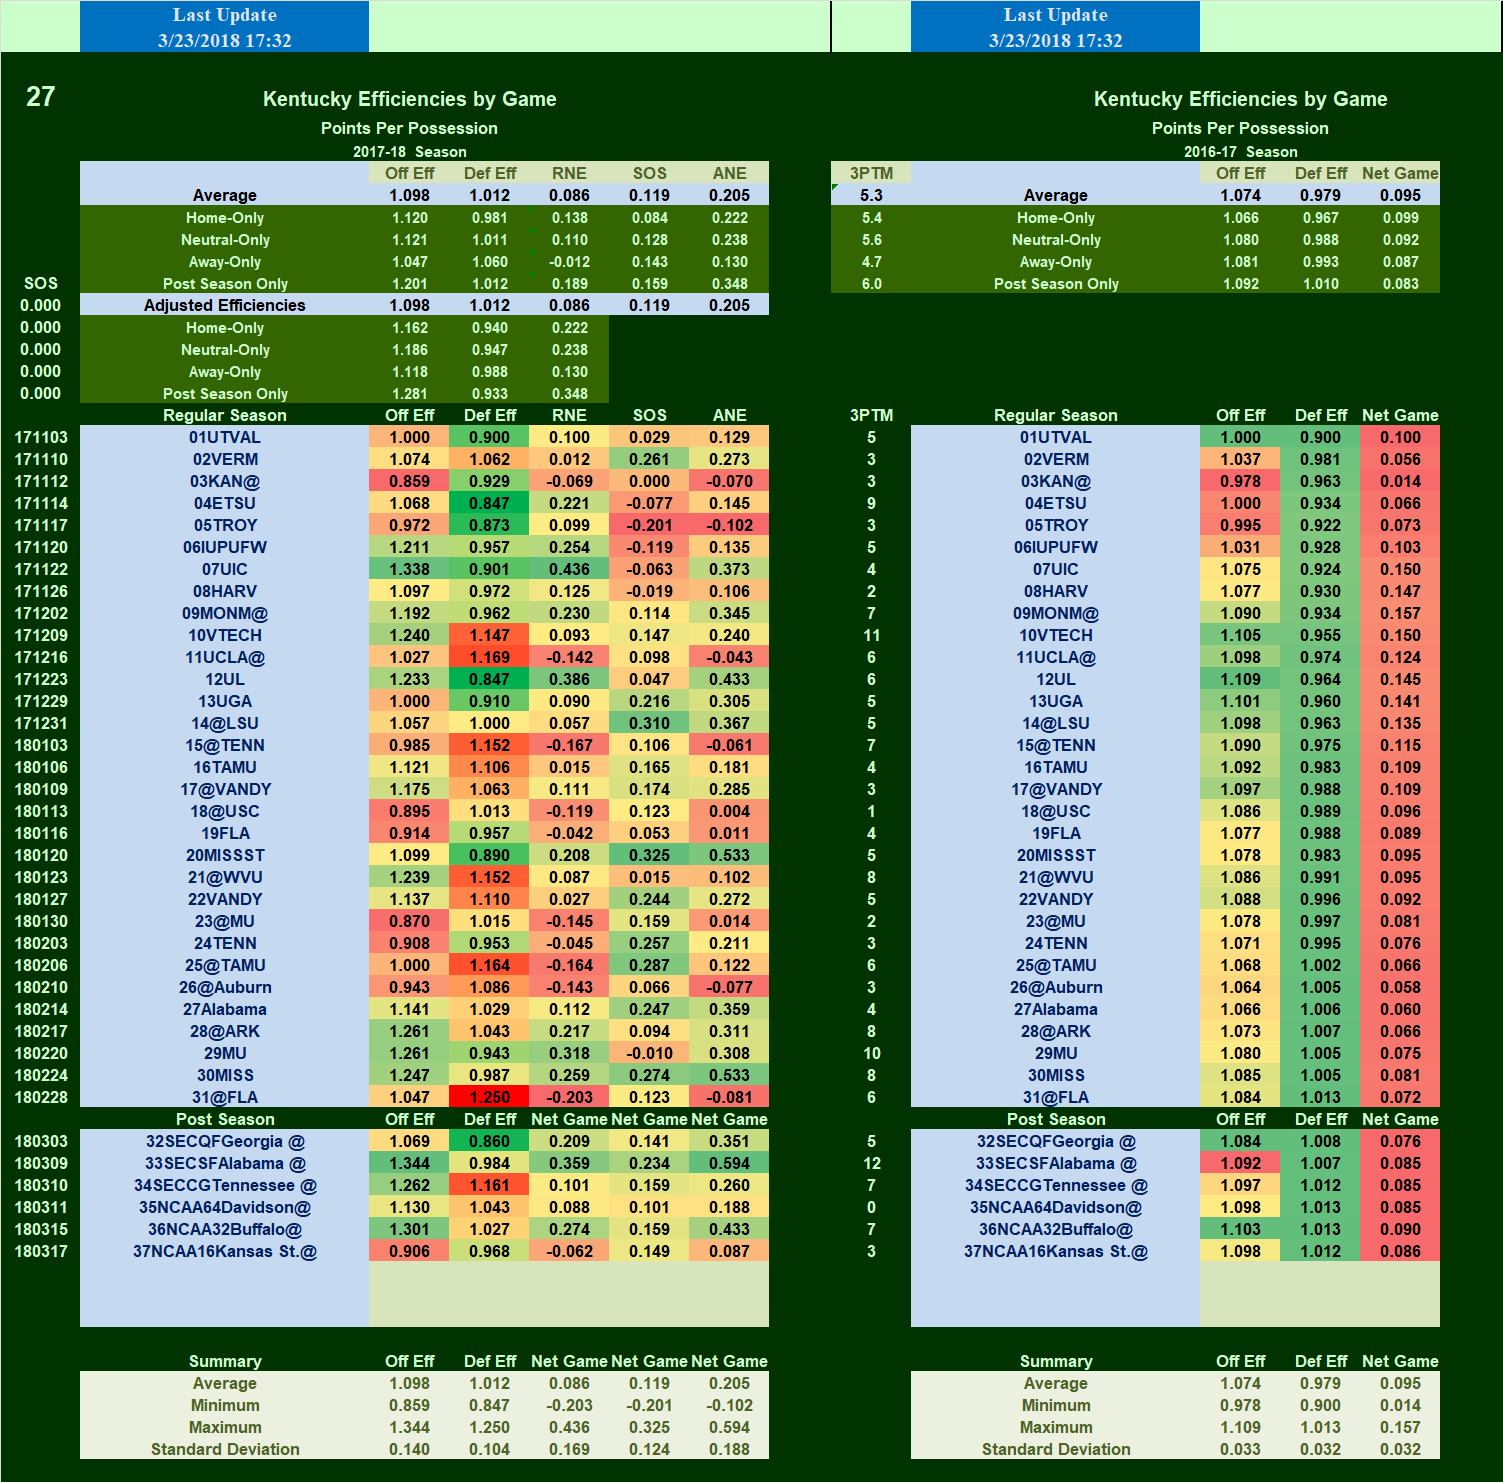
OFFENSIVE, DEFENSIVE AND NET GAME EFFICIENCIES BY GAME
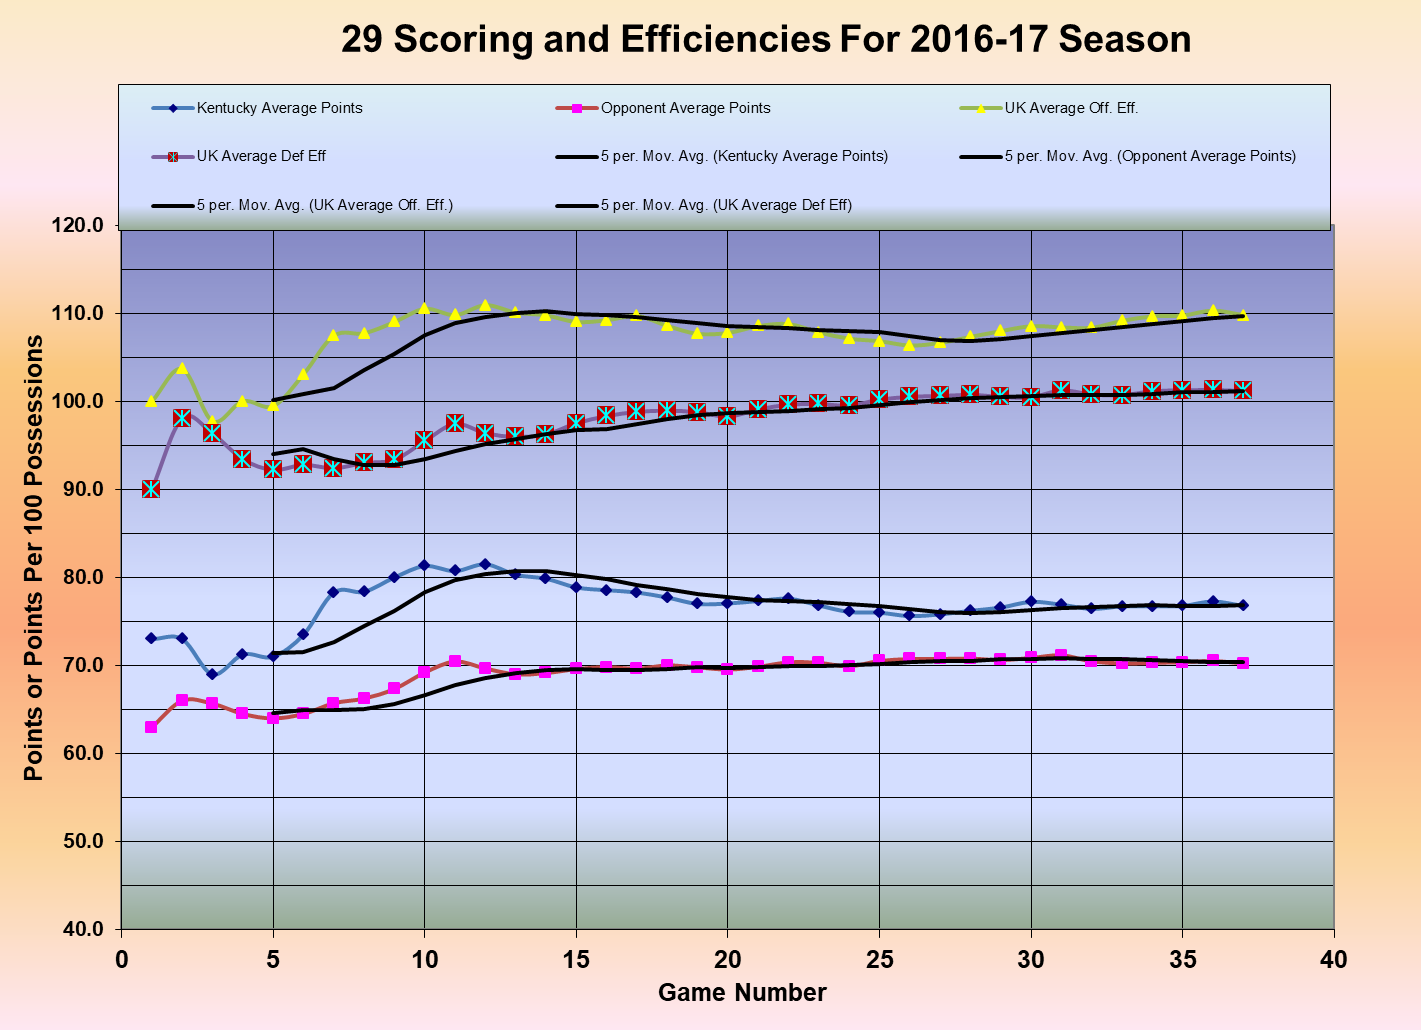
Offensive and Defensive Efficiency Trends
Track Game by Game Throughout Season
ALL TABLES AND GRAPHS ARE UPDATED FOLLOWING EACH GAME DURING THE SEASON
The above data is presented in the next series of tables providing more detail in two respects. First, the tables examine more categories of statistics, and second, the data is sorted based on the following factors, in the order shown below:
You may link to any of these sorted data pages using the links above, or you can browse them in sequence using the "Continue" buttons at the bottom of each page.
To the SEASON COMPARISONS WITH NCAA D1 AVERAGES1. Pace values will be lower, by the number of offensive rebounds.
2. Efficiencies will be higher due to the lower number of total possessions
3. Turnover rates will be higher due to the lower number of possessions.
CHECK OUT THESE OTHER ANALYTICAL WRITINGS
Change in Position on Definition of Possessions
Do Objective Performance Measures Like NGE
Account For Intangible?
Copyright 2008-15
SugarHill Communications of Kentucky
All Rights Reserve