BIG BLUE FANS FOR
![]()
BASKETBALL
![]()
My goodness how the NCAA Tournament landscape has changed for the Kentucky Wildcats. Yes, as originally noted, the NCAA Selection Committee placed the Cats into the South Region, and Kentucky faced Davidson in the first round. However, #13 seed Buffalo eliminated #4 seed Arizona from Kentucky's path and #16 seed UMBC eliminated #1 seed Virginia from Kentucky's path. Each of these upsets occurred in the first round, while the Cats fought off a pesky Davidson to advance to the second round to find #13 Buffalo instead of #4 Arizona.
A win over Buffalo would send the Cats into the Sweet 16 to face the winner of either #9 Kansas State (also a first round upset winner over #8 Creighton) and #16 UMBC. However, the forecast beyond the Sweet 16, should the Cats get past either Kansas State or UMBC, remained forbidding with #2 Cincinnati and #3 Tennessee both advancing to the second round. The Cats handled Buffalo in the second round with considerable ease, winning by 20 points, and Kansas State managed to pull away from pesky UMBC in the last few minutes to move to the Sweet 16 to face Kentucky. The other side of the South Regional brackets continued to transform as both #3 Tennessee and #2 Cincinnati fell to #11 Loyola Chicago and #7 Nevada.
On the eve of the NCAA's Sweet 16, Kentucky moves to Atlanta as the highest seeded team in the region still standing. To advance to the Elite 8, the Cats from Lexington must defeat the Cats from Kansas State, and if they manage to advance, the Wildcats will have to defeat either #7 Nevada or #11 Loyola Chicago to punch another ticket to the Final Four.
If the Cats do make another Final Four appearance as the South Region Champion, they will face the champion of the West Region in the Semifinals. While the fall of all four top seeds in the South Region is remarkable, the West Region has not been free from the upset bug where the top two seeds have also fallen, and #3 Michigan and #4 Gonzago are the highest seeds still standing in the West. If the Cats continue advancing, they will probably then encounter Nevada, followed by either #3 Michigan or #4 Gonzaga in the Final Four.
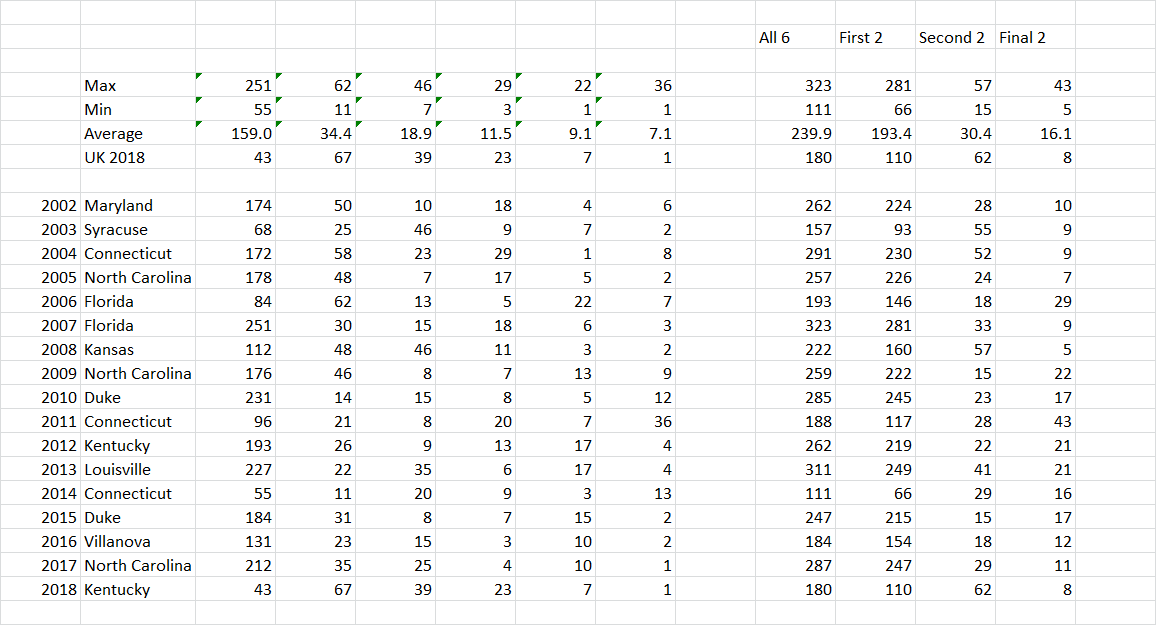
The Cats enter the Sweet 16 with an ANE of 0.213 points per possession (ppp). However, the Cats have finished strong, and over their last 10 games (9-1), the Cats played at an average ANE of 0.315 ppp for those 10 games. The following Table provides the season ending ANE and the ANE for the last 10 games for each of Kentucky's potential South Regional and Final Four opponents. In addition, the percentages above each opponent are the percentage of games that UK played well enough to beat this opponent for the entire season and the last 8 games.
| Last 8 Games |
|
90.0% |
90.0% |
||
| Full Season | 58.3% |
50.0% |
66.7% |
||
Kentucky vs. |
Kansas State |
Nevada |
Loyola Chicago |
||
| Last 10 Games ANE | 0.315 |
0.202 |
0.204 |
0.194 |
|
| Full Season ANE | 0.213 |
0.152 |
0.207 |
0.126 |
Just as Kentucky has found its stride over the last 10 games, and played at a substantially higher level during the final 10 games, so have Kansas State and Loyola Chicago. However, Kentucky's improved play represents an increase in the ANE of 0.111 ppp while Kansas State's and Loyola Chicago's increases have been more modest, 0.050 ppp and 0.068 ppp respectively.
KANSAS STATE (Sweet 16):
Based on season ending ANE values, the Cats played well enough to beat Kansas State in 58.3% of their games this season. In contrast, Kansas State only played 40% of its games well enough to beat the Cats this year. If we focus only on the last 10 games, the Cats played well enough to beat Kansas State in 90.0% of the final 10 games, while Kansas State only played well enough to beat the Cats 22.2% of the time over the last 9 games.
The traditional approach to set a game line indicates Kentucky is favored over Kansas State by 4 to 5 points. Vegas opened with a line of Kentucky -6. However, if the data for the last 10 games are used, the line would be in the range of 7 to 8 points.
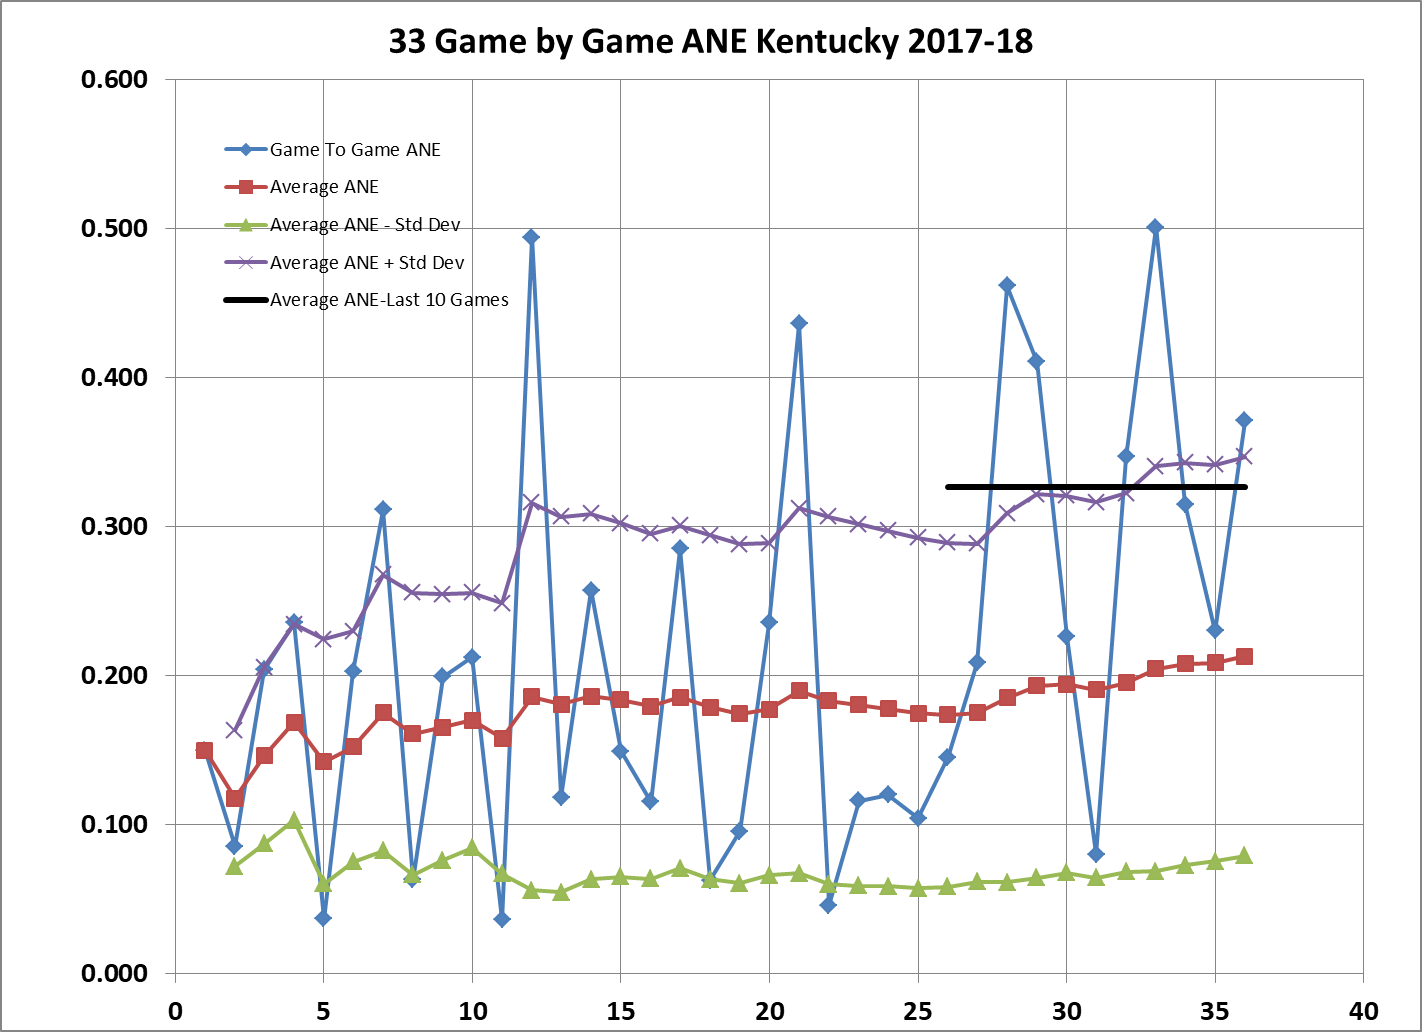
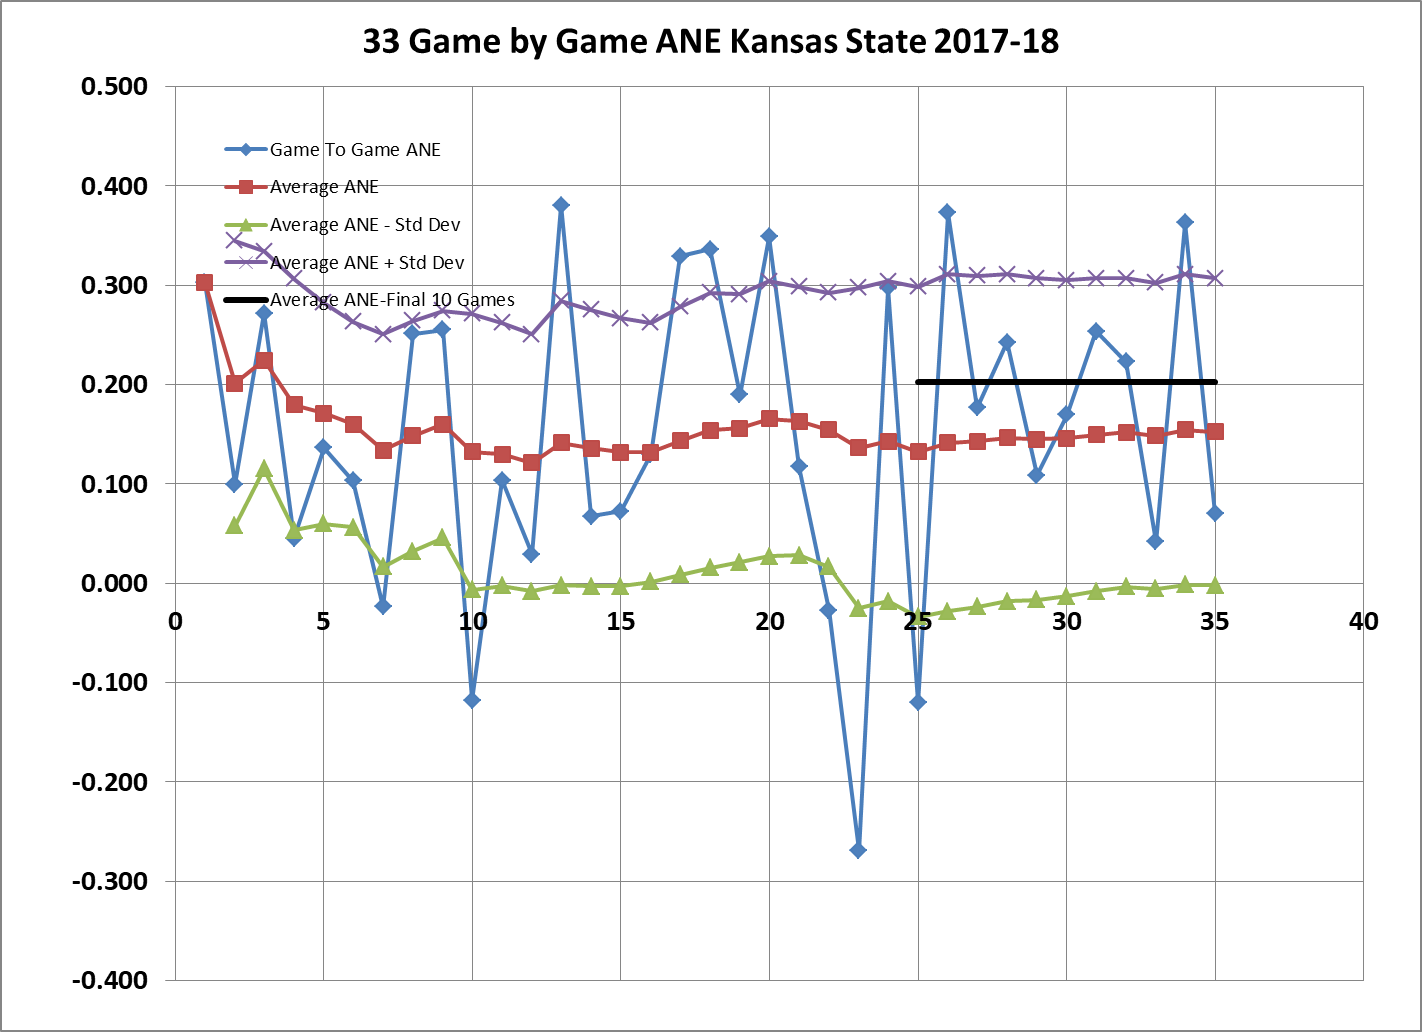
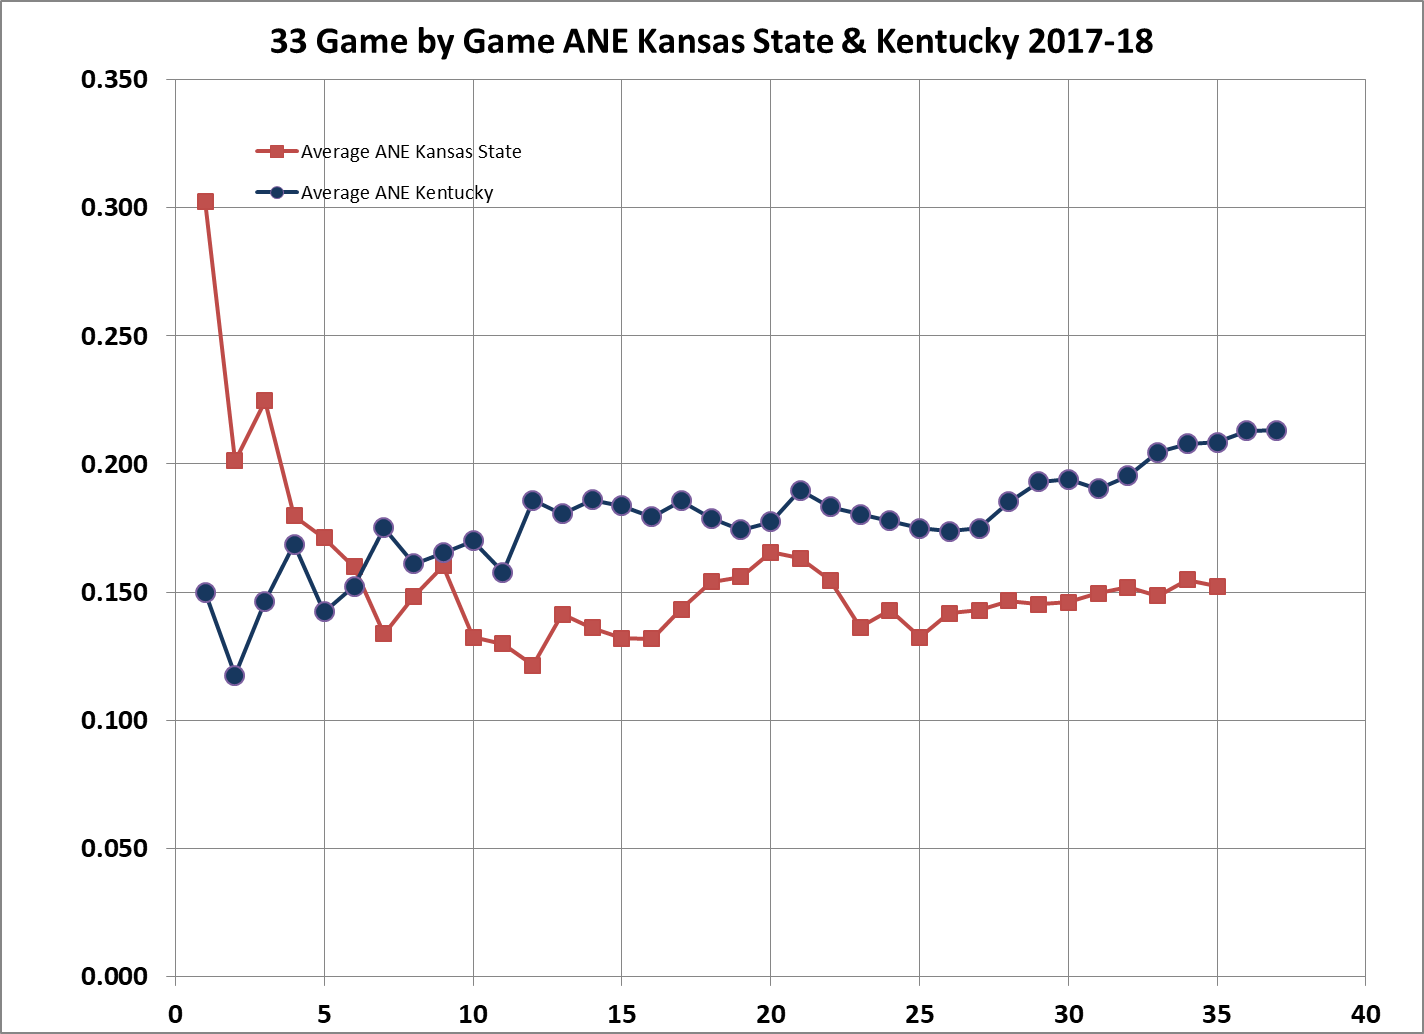
The following three graphs track Kentucky's game to game ANE, Davidson's game to game ANE, and a direct comparison of average ANE with Kentucky's average throughout the season.
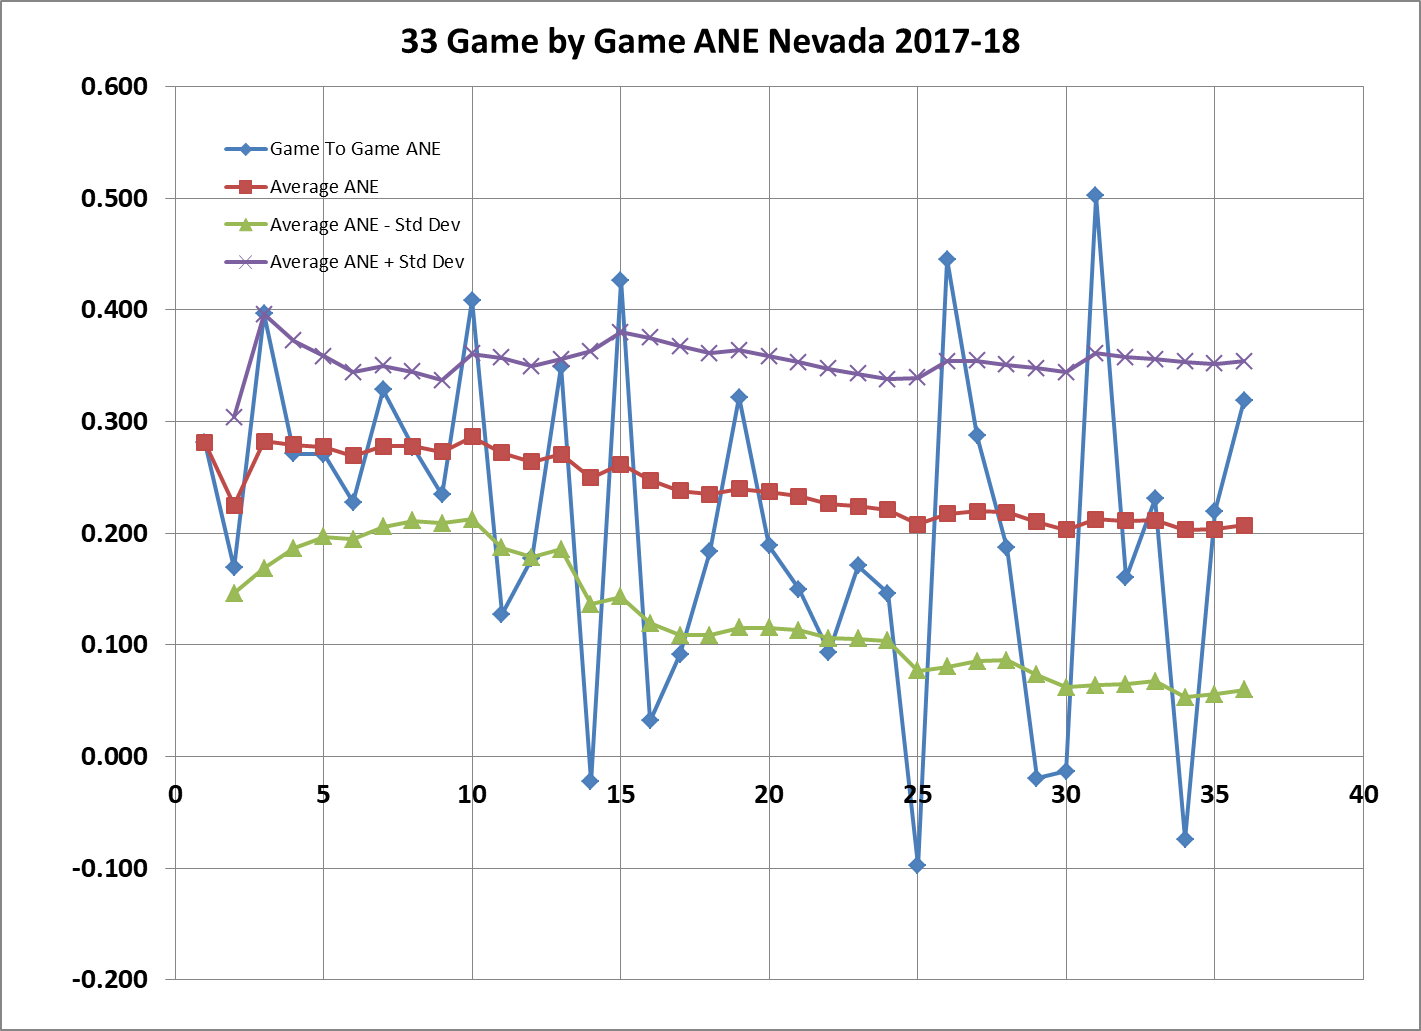
NEVADA (Elite 8):
Should the Cats advance to the Elite 8 and face Nevada, the analysis is very similar. Based on season ending ANE values, the Cats played well enough to beat Nevada in 50.0% of their games this season. In contrast, Nevada played 50% of its games well enough to beat the Cats this year. If we focus only on the last 10 games, the Cats played well enough to bead Nevada in 90.0% of the final 10 games, while Nevada only played well enough to beat the Cats 27.3% of the time over the last 11 games.
The traditional approach to set a game line indicates Kentucky should be favored over Nevada by 1 point, and it could be a legitimate pick 'em game. However, if the data for the last 10 games are used, the line would be in Kentucky's favor by about 7 1/2 points.
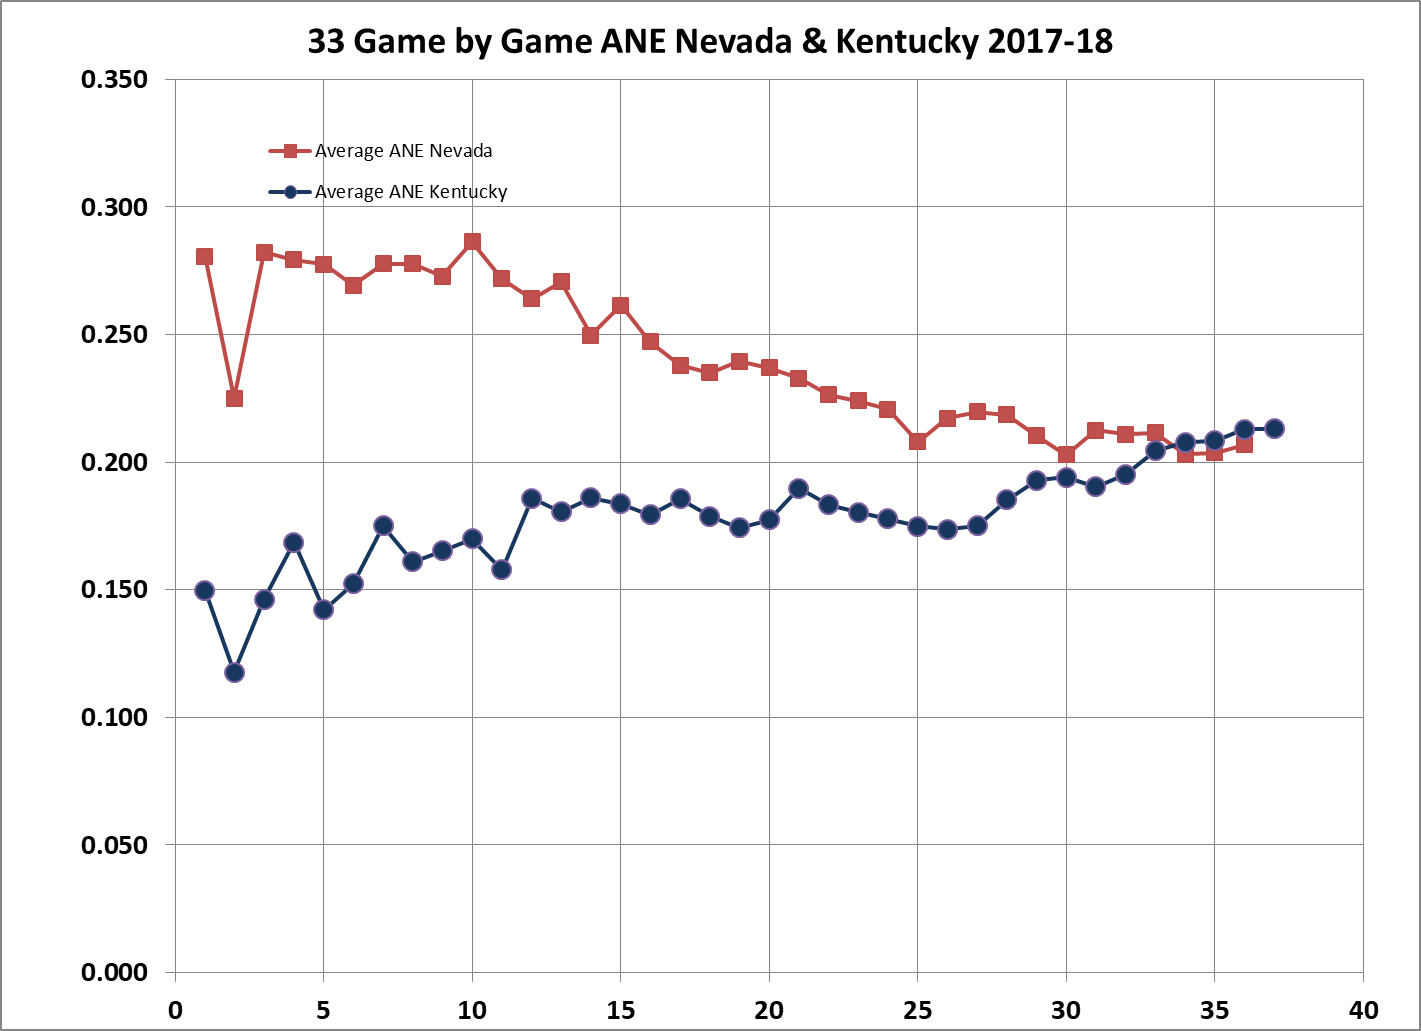
The following two graphs track Nevada's game to game ANE, and a direct comparison of average ANE with Kentucky's average throughout the season.
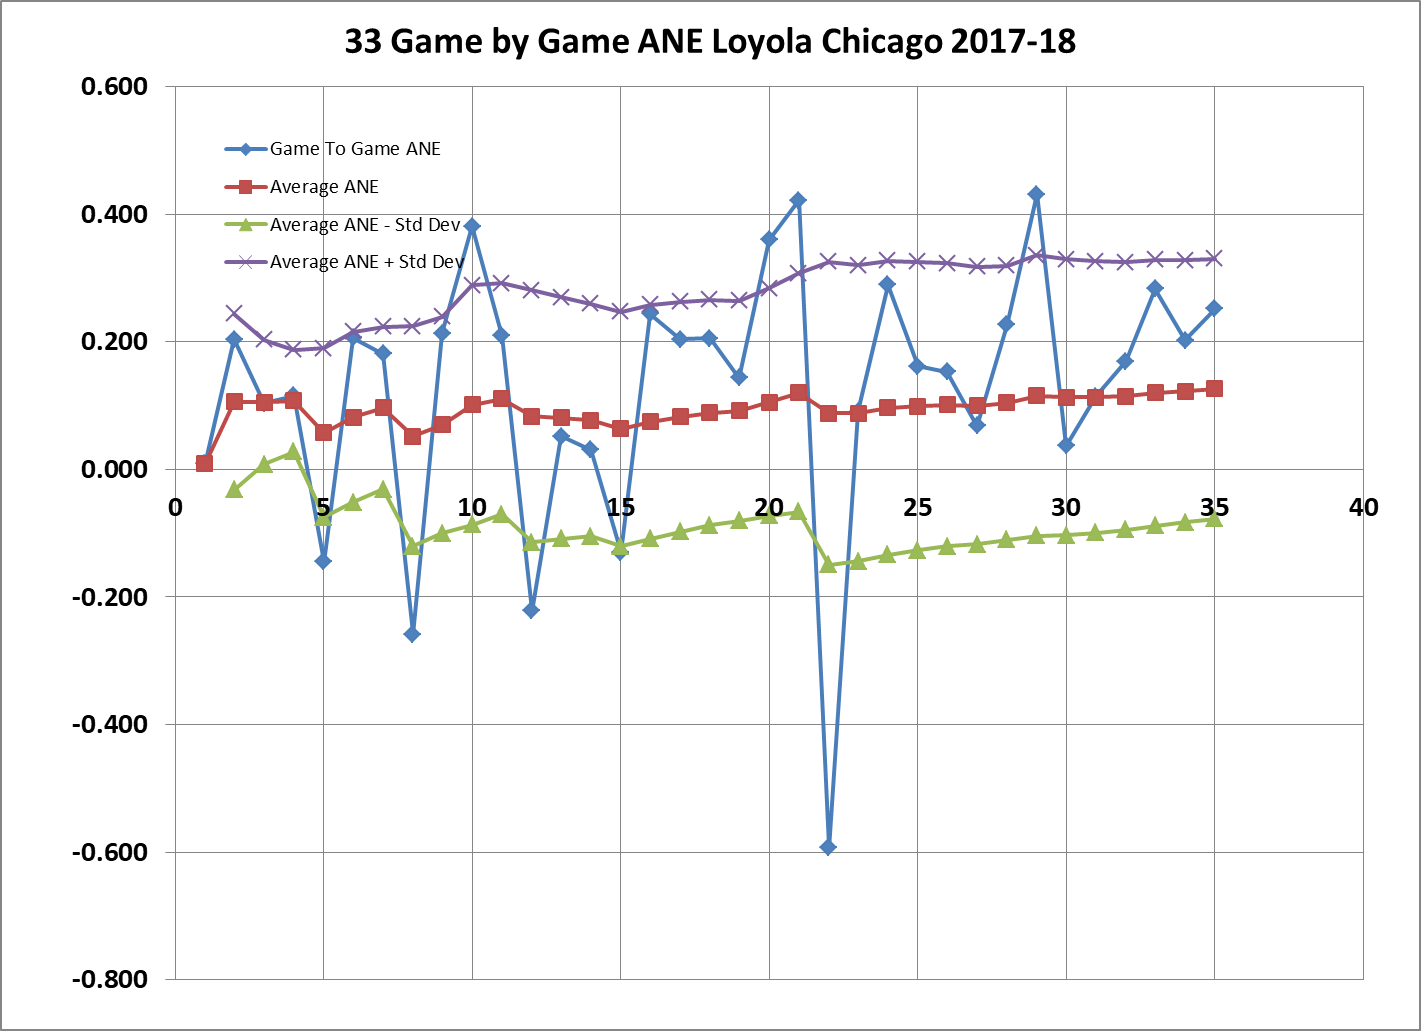
LOYOLA CHICAGO (Elite 8):
Should the Cats manage to advance to the Elite 8 and face Loyola Chicago, the analysis is similar, but the results vary from the previous two because Loyola Chicago is frankly not as strong as either Kansas State or Nevada. Based on season ending ANE values, the Cats played well enough to beat Loyola Chicago in 66.7% of their games this season. In contrast, Loyola Chicago played 25.7% of its games well enough to beat the Cats this year. If we focus only on the last 10 games, the Cats played well enough to bead Loyola Chicago in 90.0% of the final 10 games, while Loyola Chicago only played well enough to beat the Cats 10.0% of the time over the last 10 games.
The traditional approach to set a game line indicates Kentucky should be favored over Loyola Chicago by about 6 points. However, if the data for the last 10 games are used, the line would be in remain in Kentucky's favor by about 8 1/2 points.
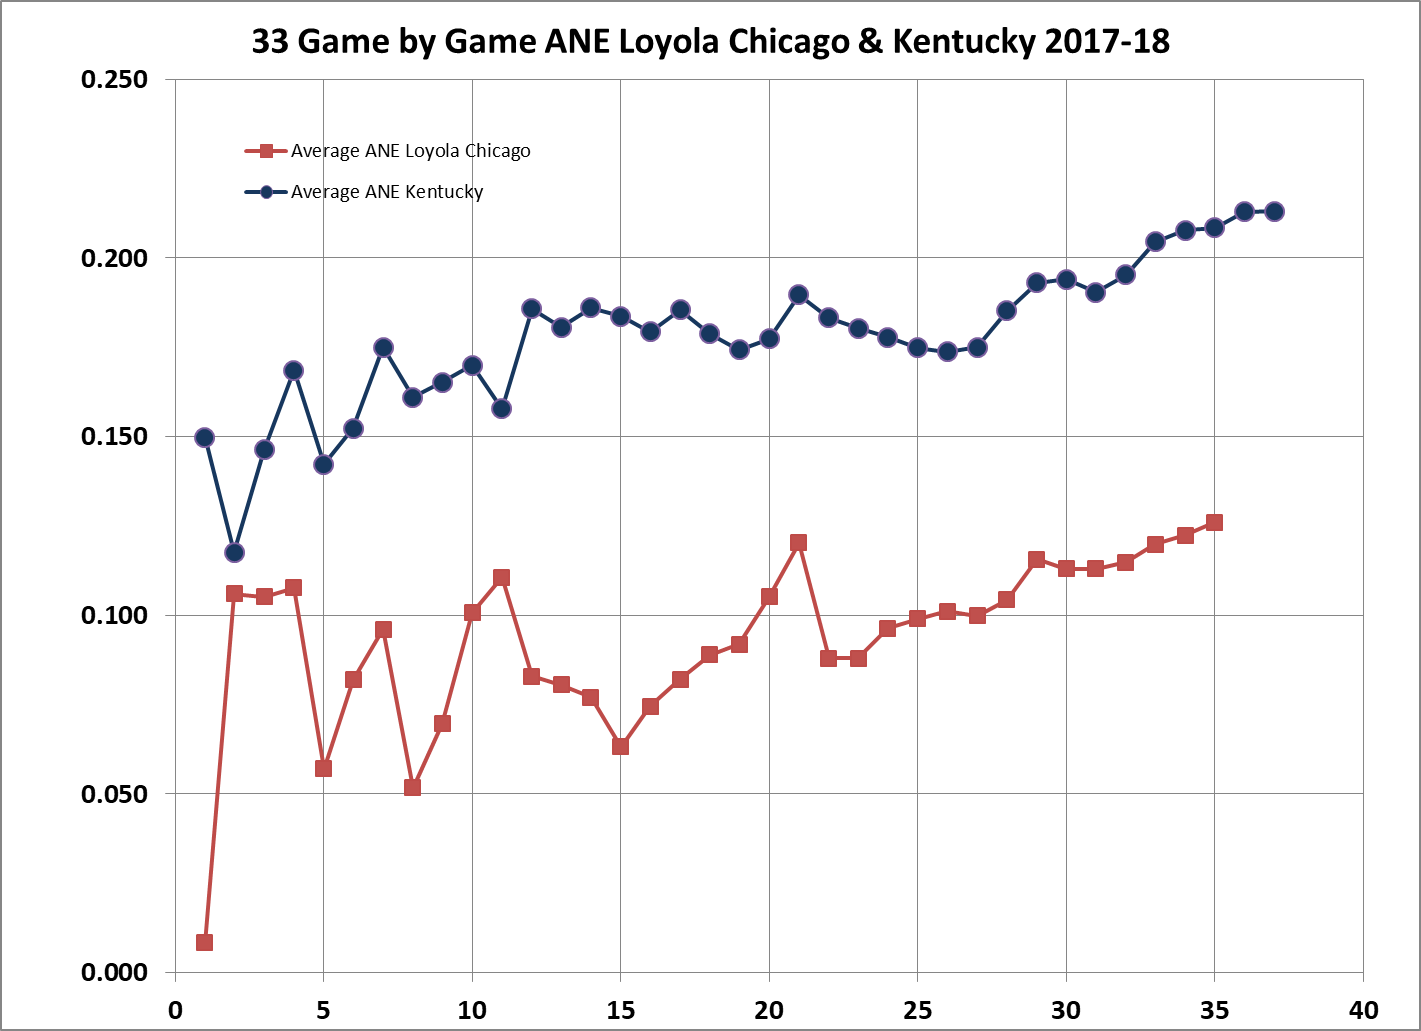
The following two graphs track Loyola Chicago's game to game ANE, and a direct comparison of average ANE with Kentucky's average throughout the season.
1. Pace values will be lower, by the number of offensive rebounds.
2. Efficiencies will be higher due to the lower number of total possessions
3. Turnover rates will be higher due to the lower number of possessions.
CHECK OUT THESE OTHER ANALYTICAL WRITINGS
Change in Position on Definition of Possessions
Do Objective Performance Measures Like NGE
Account For Intangible?
Here is an example Possible ANE Based Seeding for 2017
Copyright 2008-18
SugarHill Communications of Kentucky
All Rights Reserve