BASKETBALL
BIG BLUE FANS FOR
![]()
BASKETBALL
![]()
THIS IS THE SEC TOURNAMENT GATEWAY FOR THE 2018 TOURNAMENT
THE STANDINGS SHOWN AT THIS TIME ARE PROJECTIONS BASED
ON CURRENT STANDINGS AND PROJECTED RESULTS FOR ALL TEAMS
OVER THE REMAINING SCHEDULED GAMES,
WITH THE APPLICATION OF SEC TIE-BREAKERS AS REQUIRED
THIS PAGE WILL BE UPDATED AS STANDINGS CHANGE
OVER THE LAST 3 WEEKS OF THE REGULAR SEC SEASON
ANALYSIS OF KENTUCKY BASKETBALL
WITH TEAM AVERAGES FROM 2000 THROUGH 2018
AND COMPARED TO 1996 CHAMPIONSHIP QUALITY
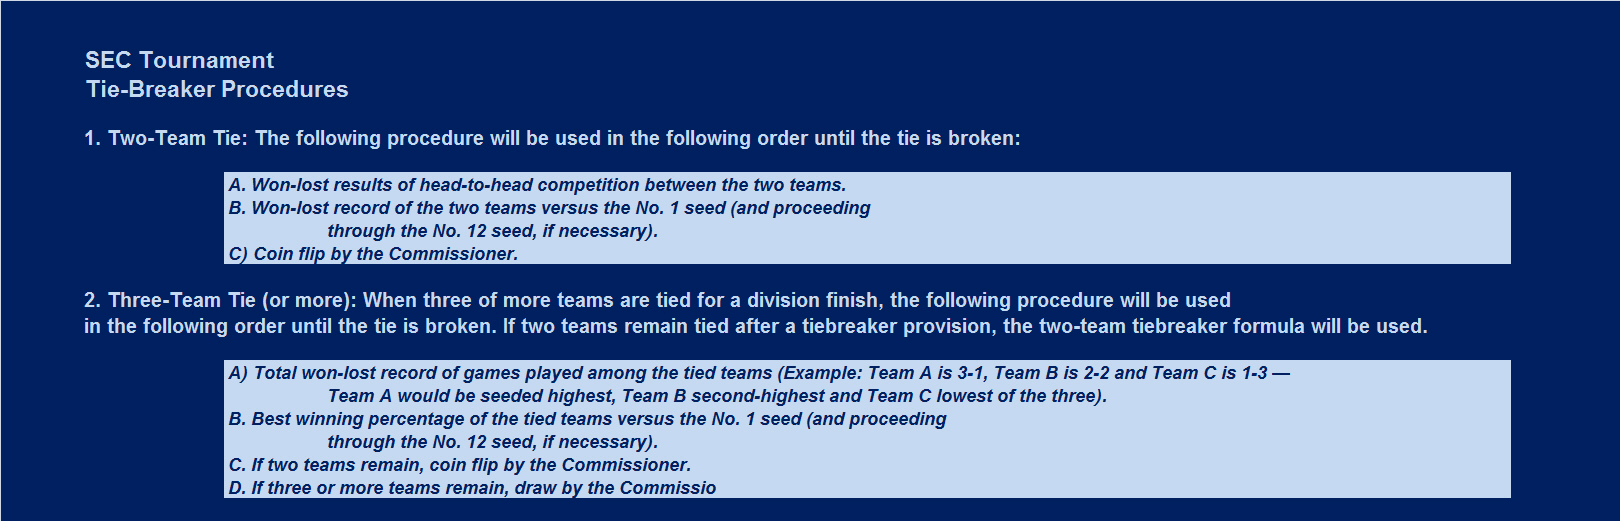
SEC TOURNAMENT BRACKETS AND PROJECTED RESULTS
BASED ON FINAL SEC STANDINGS
AND REGULAR SEASON ANE
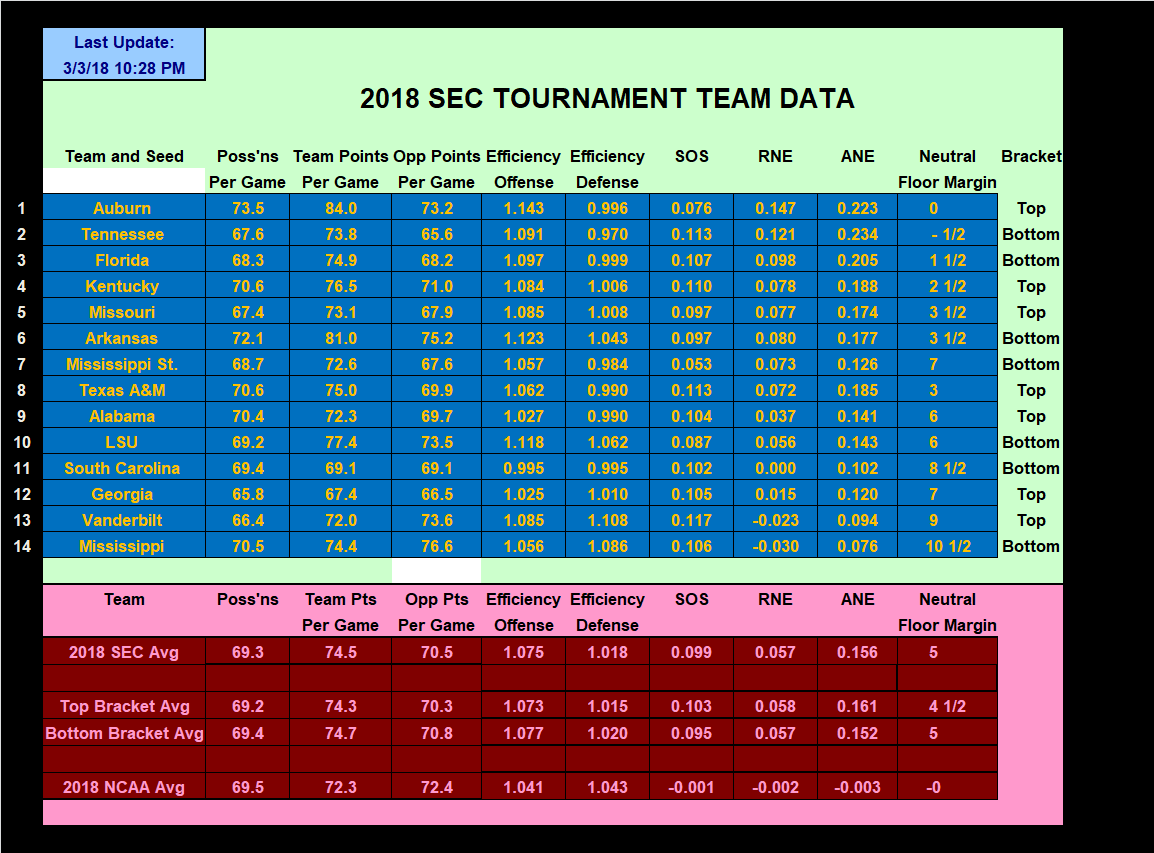
CURRENT SEC STATISTICS AND PROJECTED FINAL SEC RECORD
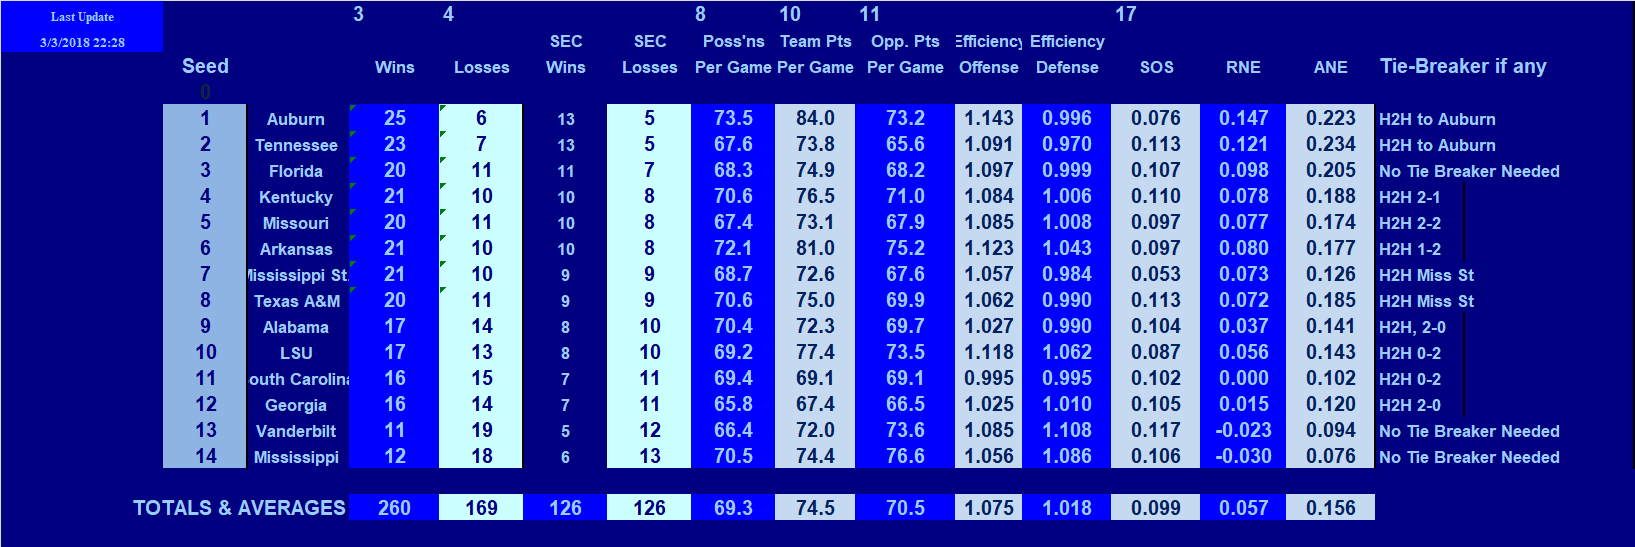
PROJECTED TOURNAMENT SEEDING
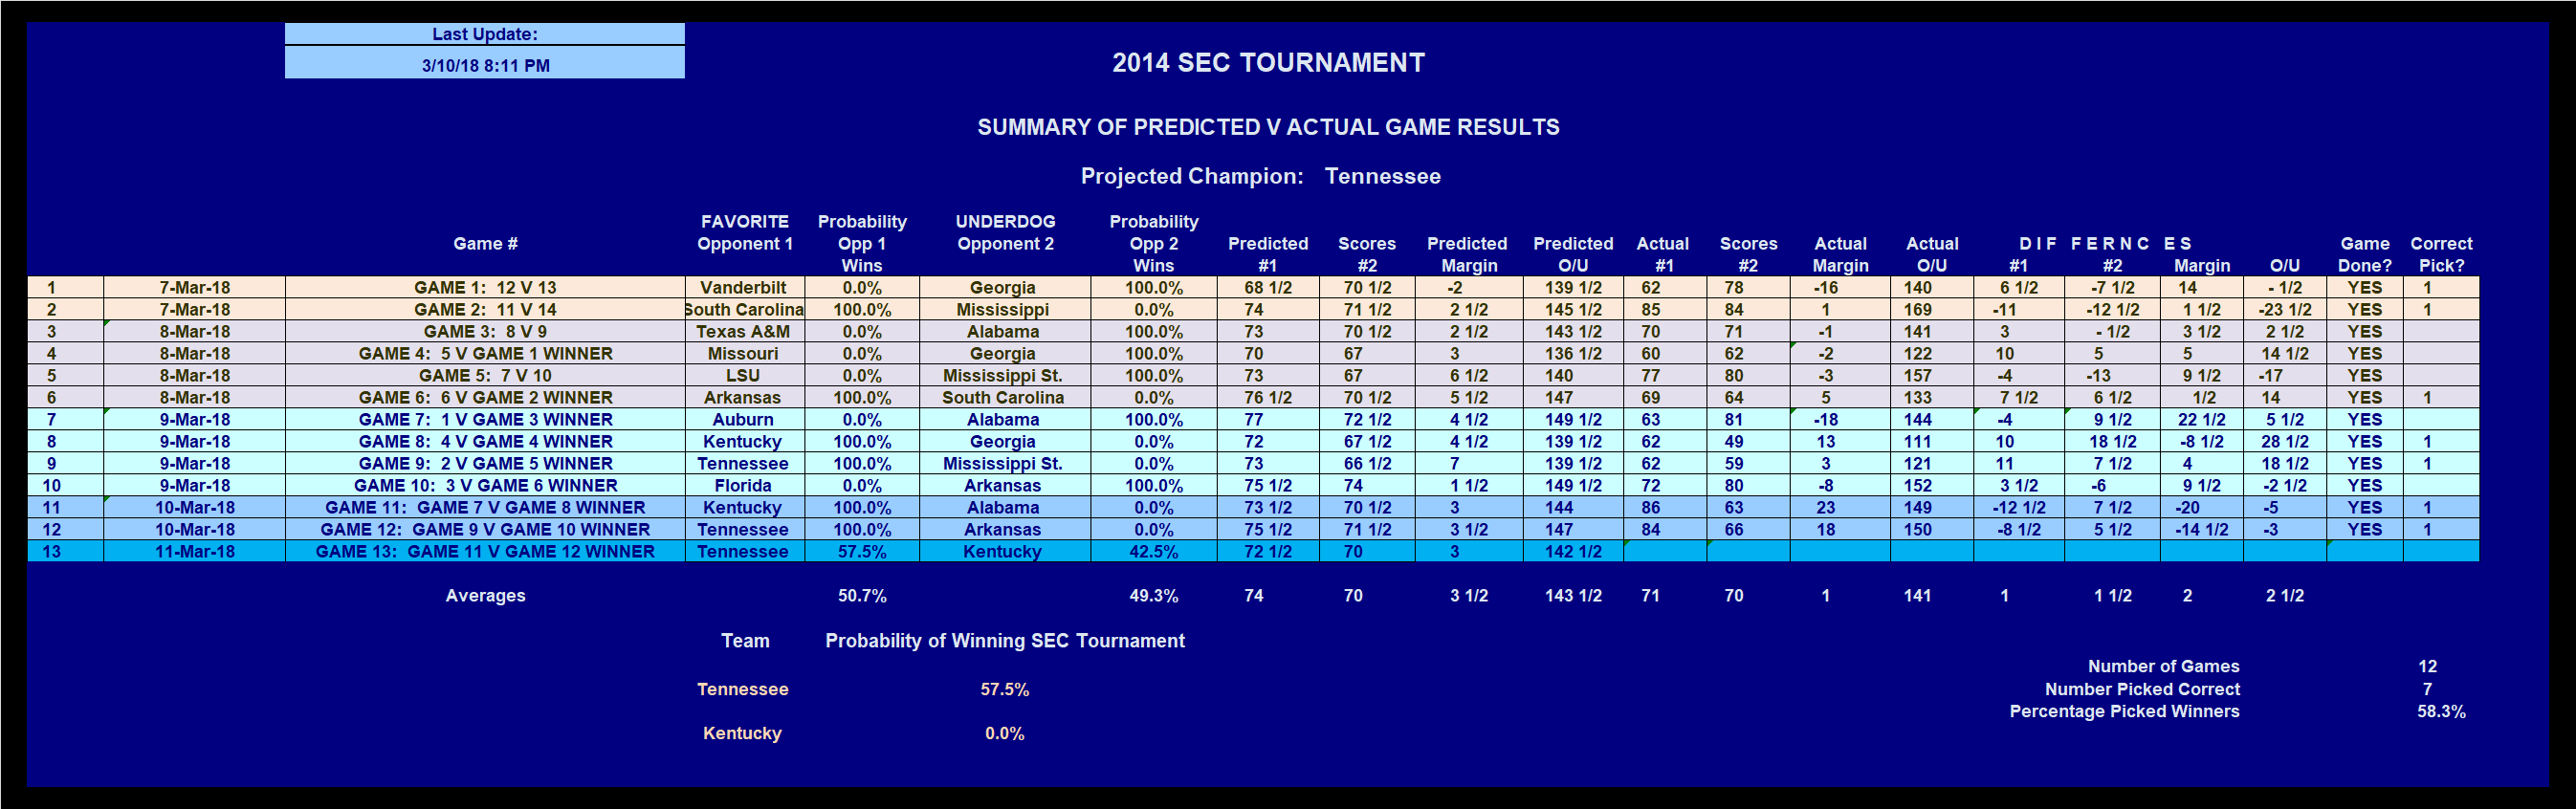
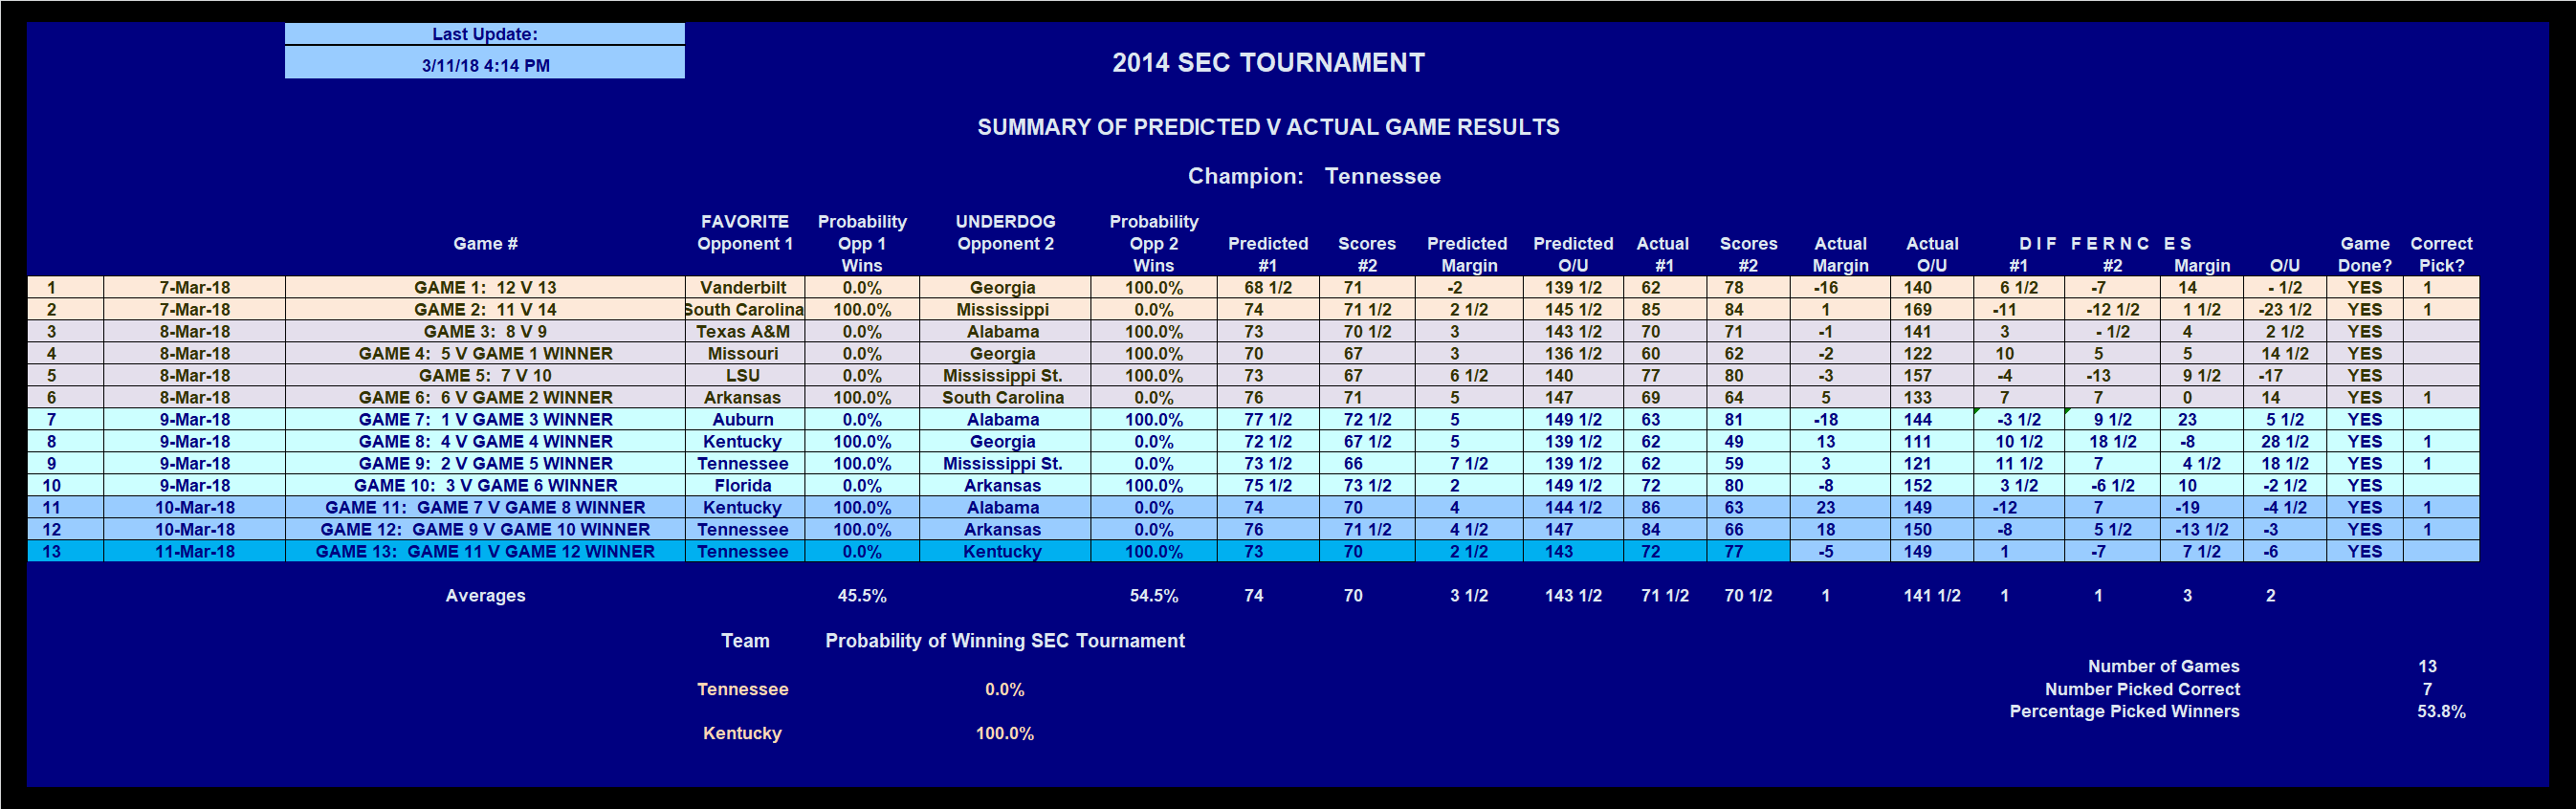
SUMMARY OF PREDICTED V ACTUAL GAME BY GAME RESULTS
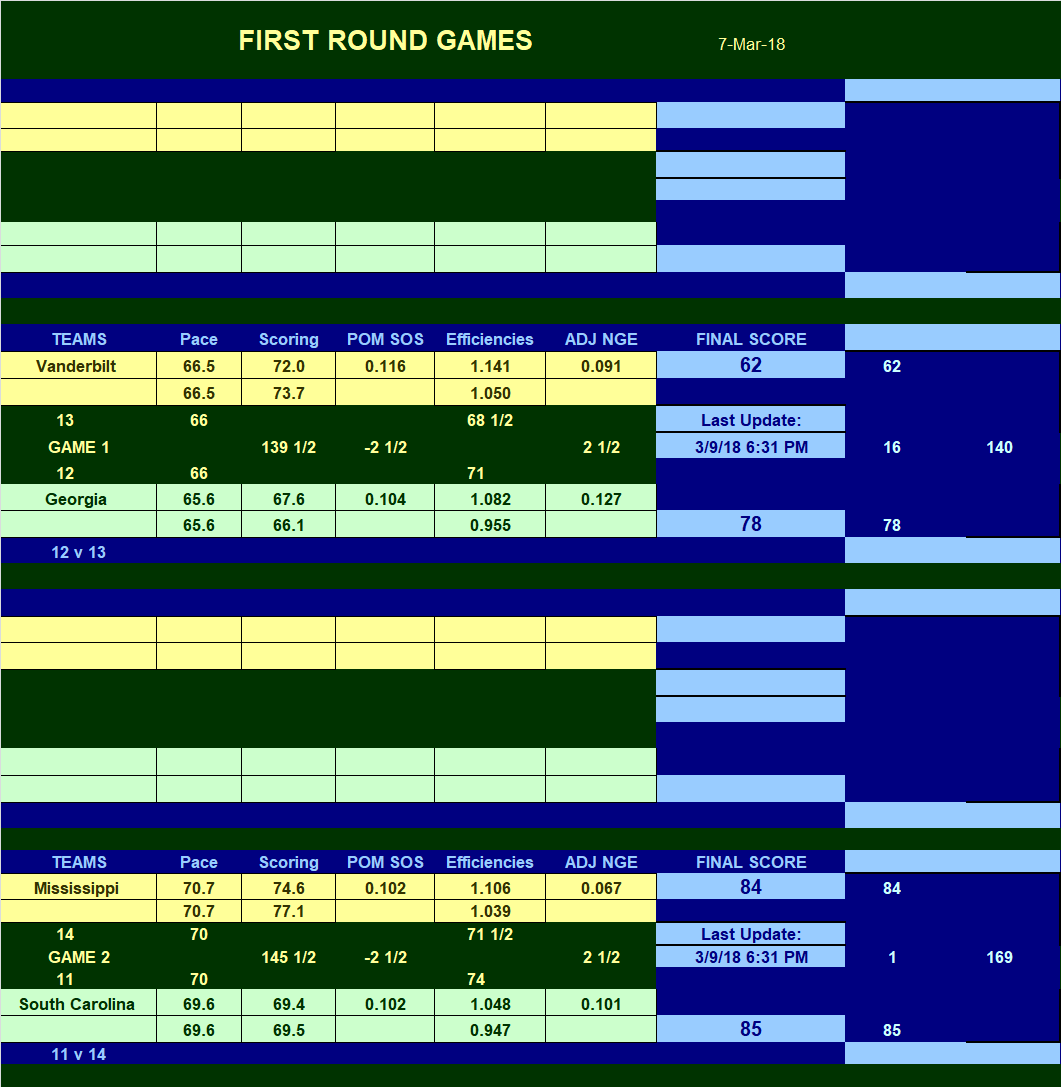
FIRST ROUND GAMES-PROJECTED
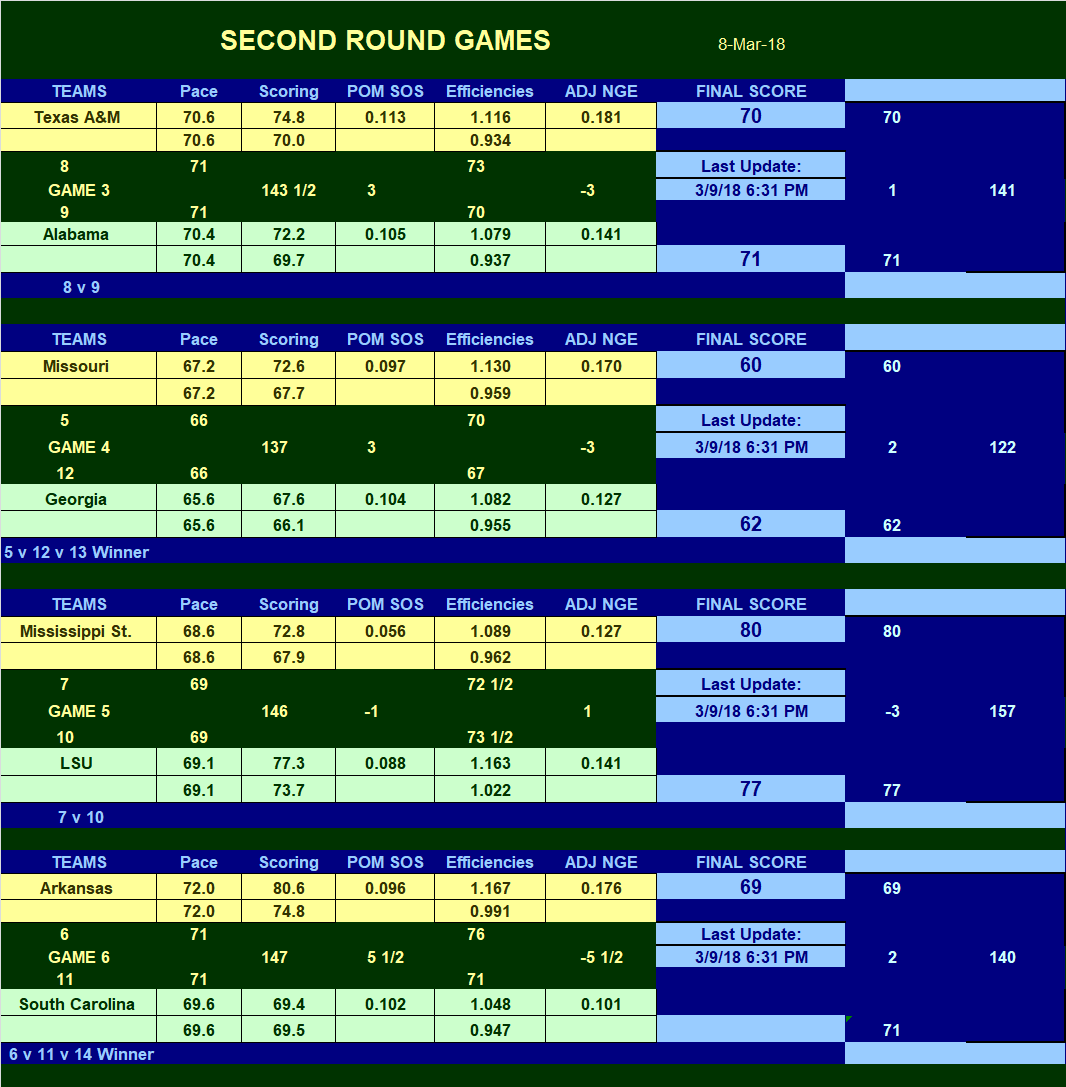
SECOND ROUND GAMES-PROJECTED
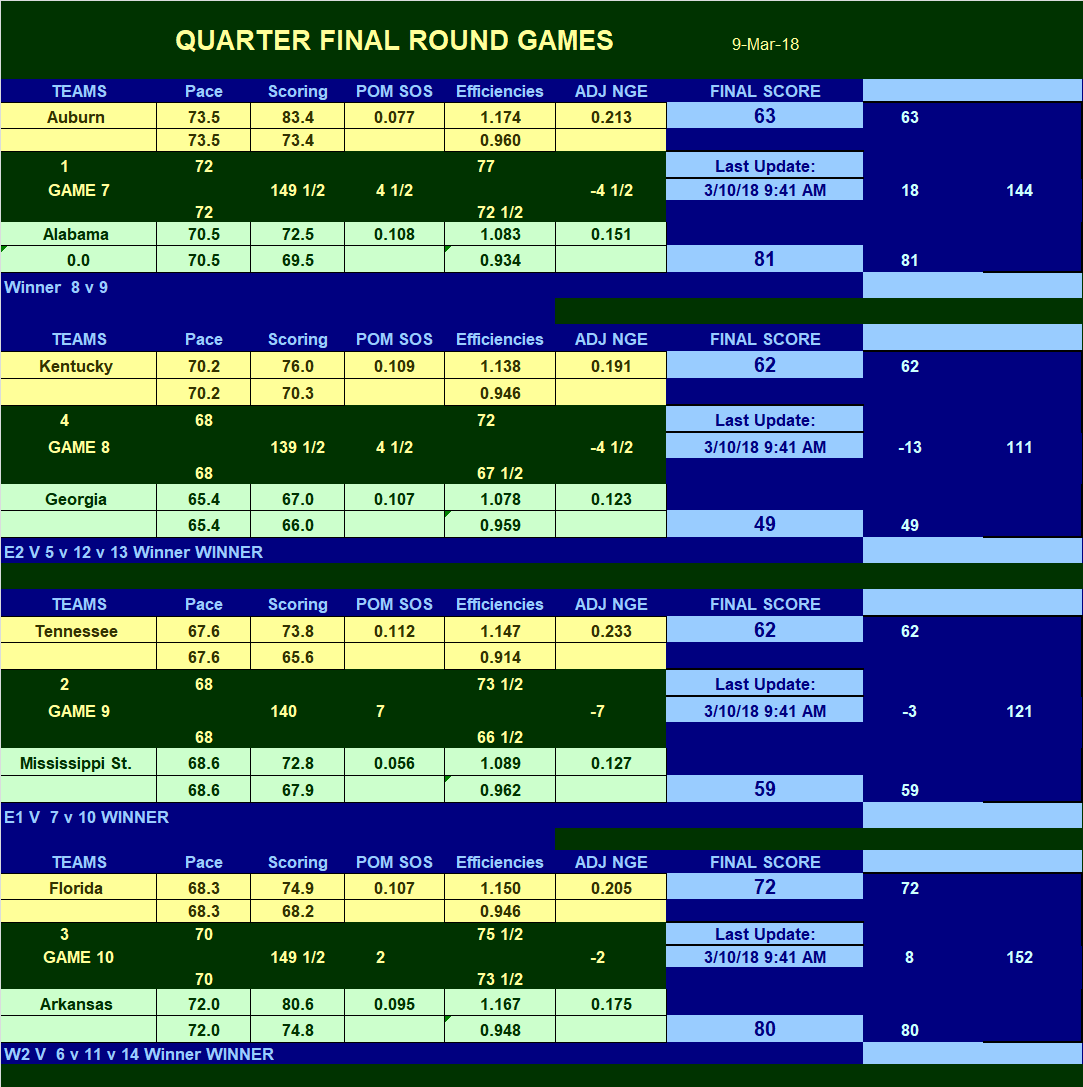
QUARTER FINAL GAMES-PROJECTED
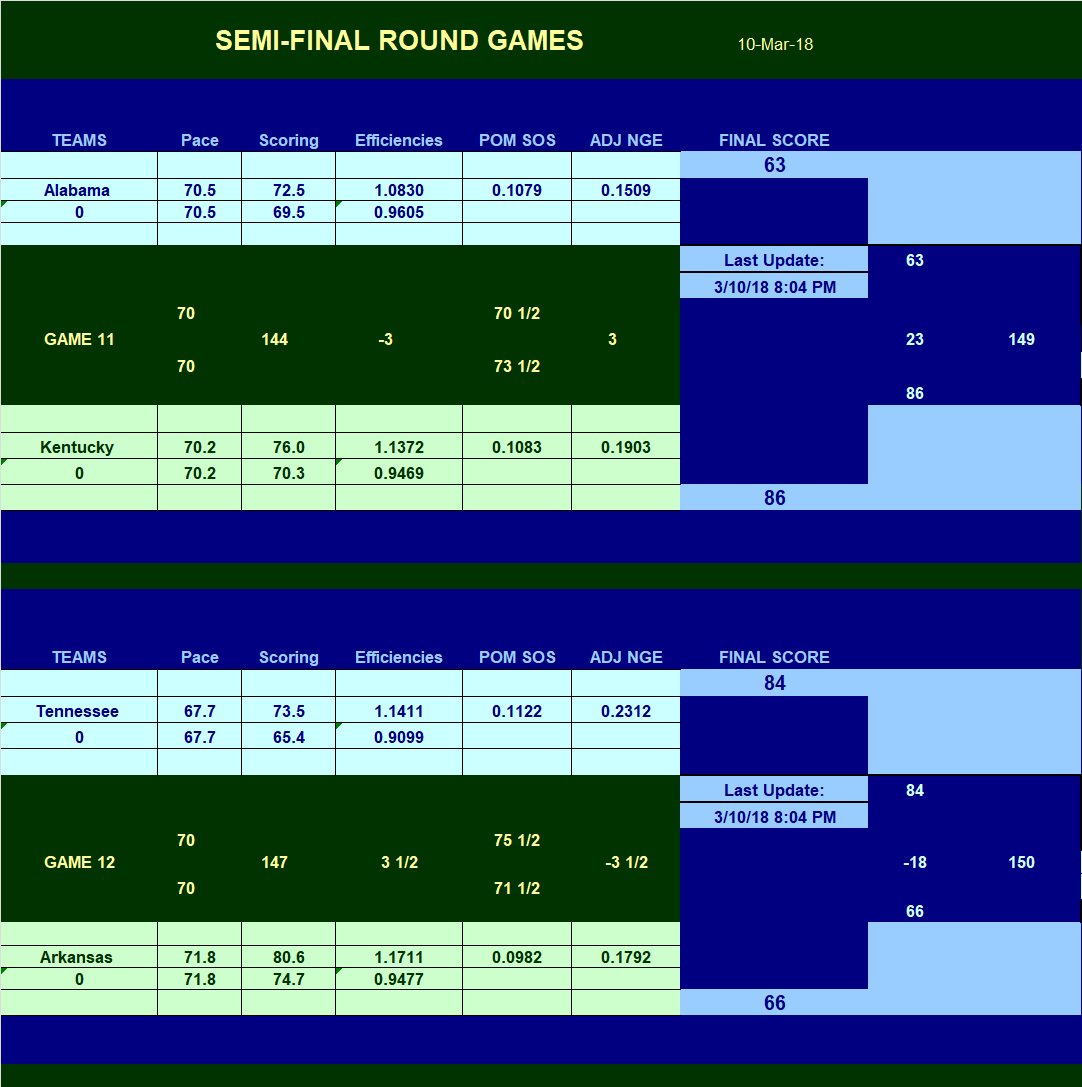
SEMI-FINAL GAMES-PROJECTED
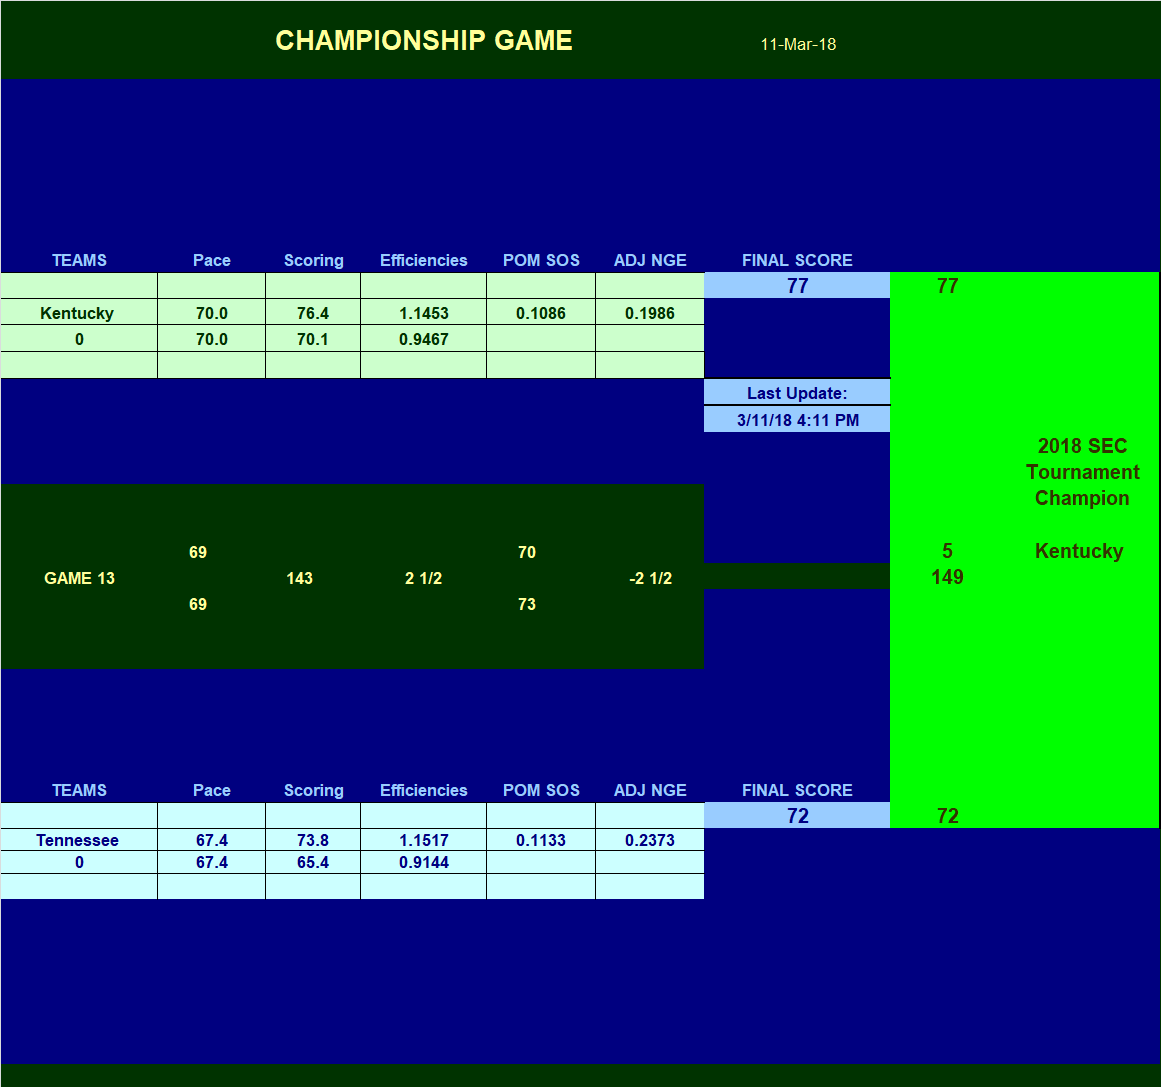
CHAMPIONSHIP GAME-PROJECTED
This Tournament, I will be tracking an alternative predictive model, using median ANE rather than mean ANE values for each team. Here is the prediction v actual table for this alternative. The major outcome difference is Missouri beating UK in the quarterfinals using the alternative modeling.
Data for UK Teams 1996, and 2000 Through 2017 for Each Sort Category
Noted Below:
You may link to any of these sorted data pages using the links above, or you can browse them in sequence using the "Continue" buttons at the bottom of each page.
1. Pace values will be lower, by the number of offensive rebounds.
2. Efficiencies will be higher due to the lower number of total possessions
3. Turnover rates will be higher due to the lower number of possessions.
CHECK OUT THESE OTHER ANALYTICAL WRITINGS
Change in Position on Definition of Possessions
Do Objective Performance Measures Like NGE
Account For Intangible?
Copyright 2018
SugarHill Communications of Kentucky
All Rights Reserved